Google dissected 14.65 million Gemini conversations: 86% of everyday chats have nothing to do with work
- Google laid out 14.65 million real Gemini conversations and mapped each one onto the U.S. government's official lists of occupations and job tasks, chasing a question that has been argued about for years: what are people actually using AI for?
- The answer doesn't match the "AI is coming for white-collar jobs" line. On work that requires thinking and has no fixed playbook, only 6.5% of conversations ask the model to take the whole thing off the user's hands. The two most common uses are drafting (41.5%) and looking things up (29.6%).
- Wide but shallow: 68% of detailed occupation categories show someone using it, covering 88.4% of U.S. employment. But inside those jobs, the median share of tasks AI touches is one-fifth — and 29% of occupations show not a single task in use.
- Strip out developers calling the API and 86% of the remaining everyday conversations aren't about work at all. The strangest finding involves dealing with the government — permits, fines, benefits. Those topics show up in AI conversations at nearly 20 times their share of people's actual time, and roughly half of it happens outside nine-to-five.
- The discounts, stated up front: this is Google studying Google's own product data, the sample window is two weeks, it excludes enterprise and Workspace usage, and it measures what users asked AI to do — not whether AI actually delivered.
Google laid out 14.65 million conversations and counted
On July 23, 2026, Google published a study called AI & Economy ATLAS: a blog post plus a 100-page paper. It does one thing — take 14.65 million real Gemini conversations, map each onto the U.S. government's official occupation and task lists, and count what people are actually using AI for.
The first number out of the gate contradicts the loudest claim of the past two years, the one about AI replacing white-collar work. On tasks that require thinking and follow no fixed playbook, conversations aimed at "do the whole thing for me" account for just 6.5%.
The counting matters because of an awkwardness that has hung around for forty years. In 1987, economist Robert Solow made a remark that has been quoted ever since: you can see the computer age everywhere but in the productivity statistics. Productivity is how much output a person generates per hour of work. Economists call this the Solow paradox — the benefits are everywhere except in the numbers. Now it's AI's turn: the technology feels ubiquitous, yet open up employment, productivity, or growth figures and it's nowhere to be found.
Until now, answers to "what are people using AI for" came from surveys (self-reported, so unreliable and sometimes embarrassing to answer honestly) or from expert extrapolation (break a job into tasks, estimate how many could theoretically be automated). Neither is measurement. ATLAS is.
The paper carries 18 authors across Google and Google DeepMind. Diane Coyle of Cambridge and David Autor of MIT reviewed it and contributed writing. Neither reviewer was a casual pick. Autor helped invent the whole approach of breaking a job into discrete tasks and asking which of them a technology hits — the task-classification algorithm in the paper comes straight from his 2025 work with Thompson. Coyle has spent her career on where GDP as a measuring stick came from and what it misses, and the heaviest finding here lands precisely on what GDP can't measure.
How the data was assembled
Getting "AI usage" and "the labor market" to line up requires a translation layer: turn a plain-language question into a code number in official statistics. That's what the ATLAS pipeline does.
It reaches almost every job, and touches only a sliver of each
One clarification first: the U.S. government slices occupations finely — "teacher" splits into preschool, elementary, secondary, special education, and so on. The coarser list has 761 entries, the finer one 923. Below, anything tied to employment counts uses the 761 list; anything tied to task coverage uses the 923.
Start with breadth. Of 761 occupations, 68% show someone using Gemini for work (the threshold is at least 50 users worldwide). Together those occupations account for 88.4% of U.S. employment. The list isn't just software engineers and market researchers — it includes farmers, industrial engineers, and foresters.
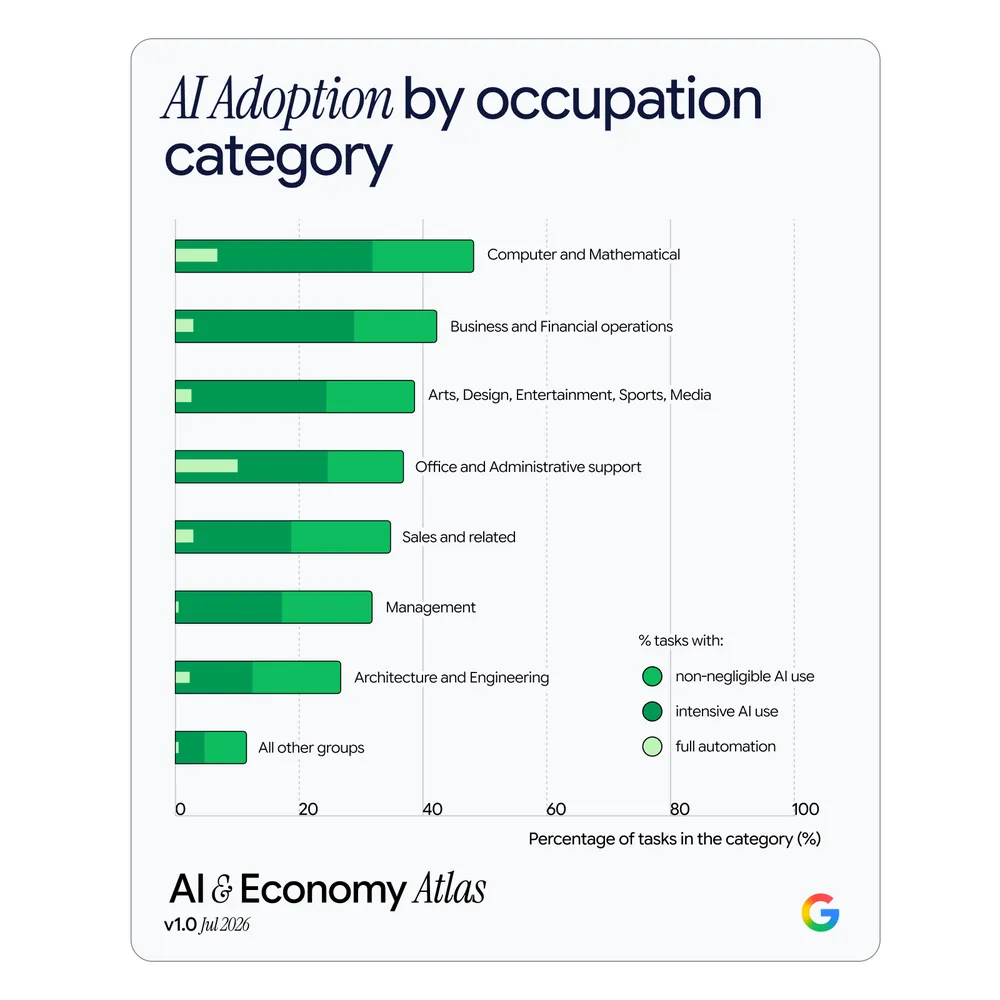
Depth is a different picture. Of the nearly 19,000 tasks in the library, about 4,000 show usage — 20%. Per occupation: among jobs with at least one qualifying task, the median share of tasks AI covers is 21%.
Note that this is a median, not an average — and it counts only occupations with at least one qualifying task. The remaining 29% cleared no threshold at all: stockers and order fillers, assembly line workers, fast food cooks, refuse collectors, patrol officers. Fold those in and real penetration is shallower still.
At the other end: roughly 30% of occupations have AI on more than a quarter of their tasks, 11% cross half, and only 3% reach three-quarters or more.
| Lowest task coverage | Highest task coverage |
|---|---|
| Special education teachers, secondary | Market research analysts and marketing specialists |
| Kindergarten teachers, except special ed | Human resources specialists |
| Special education teachers, preschool | Software QA analysts and testers |
| Nurse midwives | Document management specialists |
| English language and literature professors | Network and computer systems administrators |
Both ends of that table say something. The right column is essentially jobs whose raw material is already text and information. The left clusters in teaching and care — work aimed at a specific person, where that person's reaction in the moment determines the next move.
The paper doesn't enumerate the seven hundred-odd occupations in between. But the measurement itself is a framework you can apply to your own job: break the work into concrete tasks and count how many AI takes part in.
Touch one or two and you're near that 21% median, like most people. More than half and you're already in the top 11%. The number says nothing about good or bad, but it's far more specific than "will AI replace me" — and it sets up what the next section actually pulls apart: on the tasks where AI does show up, is it finishing the job or just starting it?
People mostly want a draft, a lookup, or a sounding board — rarely the finished job
"Heavy AI use" and "AI replacing people" are two different things. Past arguments conflated them because no data could separate them. ATLAS tries.
Step one is classifying tasks. The paper reuses the Autor and Thompson algorithm mentioned earlier, sorting all work tasks into five buckets:
| Type | What it looks like |
|---|---|
| Routine cognitive | Mental work that follows rules: data entry, filling out forms from a template |
| Non-routine cognitive | Thinking with no fixed playbook: strategy, analysis, creative design |
| Routine manual | Repetitive physical work: assembly line, loading and unloading |
| Non-routine manual | Hands-on work that requires adapting: fixing cars, installing equipment, servicing machines |
| Non-routine interpersonal | Working with people: negotiating, managing, teaching, handling employee relations |
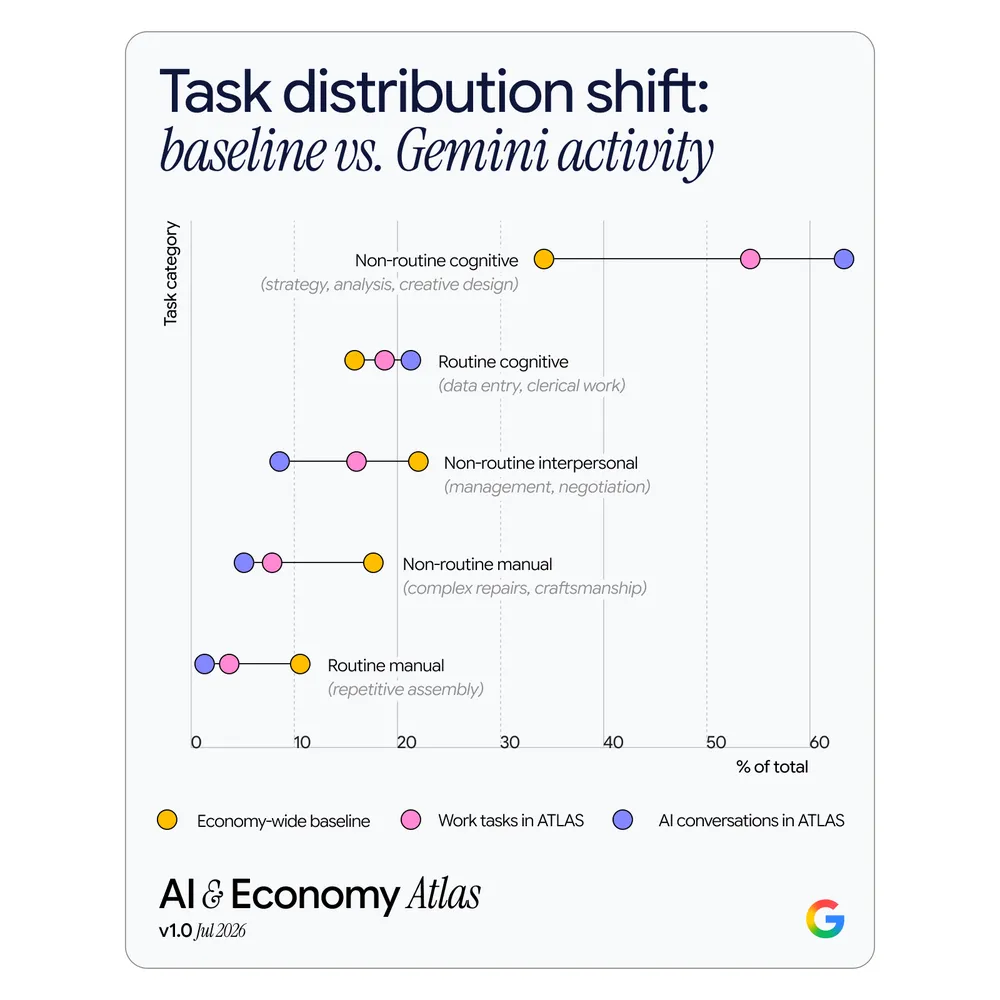
Non-routine cognitive tasks make up roughly 35% of all job tasks across the economy but 65% of work-related AI conversations. That skew isn't surprising — it's exactly what large models are good at.
Step two is where it gets interesting. Google built a second classifier to judge what role the user wanted AI to play, across five levels:
| Level | What it means |
|---|---|
| End-to-end automation | Have AI carry a task, or a major stage of it, from start to finish |
| Partial drafting | Have AI produce a draft, template, or component that still needs heavy revision, real data, or assembly into something larger |
| Review and revision | A human wrote it; AI checks and edits — say, verifying that a translation stays consistent throughout |
| Ideation and strategy | Treat AI as a colleague you can talk to, working through several sources to decide what to do |
| Learning and lookup | Ask for facts or find a how-to in service of some task |
Then those five levels get applied to four task types. Here is the full set of numbers; the five levels within each task type sum to 100%:
In plain terms: on work that genuinely requires thinking, six or seven conversations out of a hundred ask AI to do the whole job. Of the other ninety-odd, the largest share asks for a draft (41.5%), followed by looking things up (29.6%) and thinking a problem through with it (18.6%). On paperwork that follows a playbook, the share asking AI to handle it jumps to 26.9% — four times higher.
One number that's easy to miss: "review and revision" comes last in all four task types — 3.8% for non-routine cognitive, under 1% for interpersonal and manual. People are happy to let AI write a first draft, but rarely hand it their own finished work to check.
Manual tasks skew to the opposite extreme: 82.1% is "learning and lookup." Installing equipment, diagnosing a car, setting up an employee's computer — what people want is a manual they can question on the spot, not someone to do the work for them.
In ATLAS we find no evidence supporting the claims that AI is about to cause mass automation and displace white-collar work; that AI is irrelevant to blue-collar work; or that AI's purpose is to automate tasks.
ATLAS v1.0, executive summary
One qualifier travels with this conclusion: it measures what users asked AI to do, not what AI is capable of doing. The paper says so itself — the classifier's input is aggregated conversation summaries, a single cluster may blend several intents, and this version of the intent classifier is still coarse.
(Our note.) There's a layer the paper leaves unexplored: people may not ask for full automation because it isn't possible yet, or because it never occurred to them to ask. This data can't distinguish the two. But one pattern in the table is suggestive — within brain work, the more a task follows a playbook (routine cognitive), the higher the automation share (26.9%). That at least indicates people will let go when AI can genuinely take over.
Mechanics use it too — and they're the ones sending photos
The idea that AI is a white-collar thing is only half supported. Nearly a third of heavy-manual occupations show no observable usage, but in many skilled trades AI is already an on-call partner.
The paper gives two examples. Industrial machinery mechanics: 44% of their tasks are purely physical, yet thousands of AI uses land on the cognitive ones — interpreting diagnostic results, decoding machine error messages. Automotive service technicians are more extreme still: 83% of their tasks are manual, and yet the related conversations top ten thousand, covering testing vehicle components, rewiring, and inspecting parts for wear.
One concrete number: automotive technicians' share of multimodal conversations runs more than double the average across all work-related AI use. Multimodal means the conversation includes an image or video. Picture a mechanic under a lift, phone pointed at a seeping fitting, asking straight out: what's leaking here and what part do I need? That's where the doubling comes from. Office workers do it far less, because what's in front of them is already text.
The same pattern shows up across countries: in low- and middle-income countries, the share of work conversations involving generated images or video runs about twice that of developed economies.
The heaviest users earn the most — and use it on their least specialized work
Start with who uses it. For every 1% higher median wage in an occupation, AI usage intensity runs about 2.68% higher (1.86% once education is controlled for and only wage is considered). Education correlates positively too, and holds up even after controlling for income.
Another cut makes it more vivid: weight by employment and the median annual salary for a U.S. worker's occupation is $62,252. Weight the same calculation by Gemini conversation volume and it comes out at $82,919.
(the real U.S. worker median)
(the median "typical user")
(tokens ≈ how much text was exchanged: the more talk, the higher the income)
So far this matches intuition: AI is currently a tool for well-paid knowledge workers. The next step is where intuition breaks.
The paper scored all ~19,000 tasks for specialization and sorted them into four tiers. The result: relative to the task library's own distribution, the heaviest AI use falls on the least specialized tier of non-routine cognitive tasks. The examples given are "rewrite news and other material into a specified language" and "write and review procurement specifications."
"Write and review procurement specifications" doesn't sound unskilled at all, so it's worth being clear about how the score works: it looks only at how rare the vocabulary in the task description is. The more jargon an outsider wouldn't follow, the higher the score. Procurement specs can run long, but the words are common ones, so the score is low. In other words, this yardstick measures whether an outsider can parse the sentence, not how hard the work is.
Put together, it's an awkward picture: the higher the income, the heavier the use — and what they're using AI on is the part of their job that reads as least specialized.
What does that mean? The paper lays out one popular reading — highly paid white-collar workers are automating themselves — and then explicitly disagrees, writing that "our preliminary evidence points to a different dynamic." Its explanation: these workers are offloading routine mental work to AI while collaborating with it on the genuinely specialized non-routine work. If that holds, human expertise becomes more valuable, not less — at the cost of a widening income gap between people who can use AI and people who can't.
86% of conversations have nothing to do with work
Work conversations are a small corner of the whole. But the scope needs pinning down first, because it's easy to garble.
For the household analysis, the paper excludes the Gemini API, keeping only the Gemini app and AI Mode in Search — about 10 million conversations. The reasoning is that developers calling the API are mostly doing scattered work tasks, which don't represent home use. Within those roughly 10 million everyday conversations, work accounts for just 13.5%; the other 86.5% happens after hours: chores, studying, leisure, shopping, health, errands.
The excluded portion sits at the opposite extreme: 98.8% of Gemini API usage is work-related. So "86% isn't about work" applies specifically to conversations people type themselves — not to all 14.65 million.
Those everyday conversations touch 74% of the categories in the U.S. time diary taxonomy. The 26% not covered were always minor time sinks; the covered categories together account for 98% of Americans' waking hours. Which is to say: nearly everything people do in a day besides sleep, somebody is asking AI about.
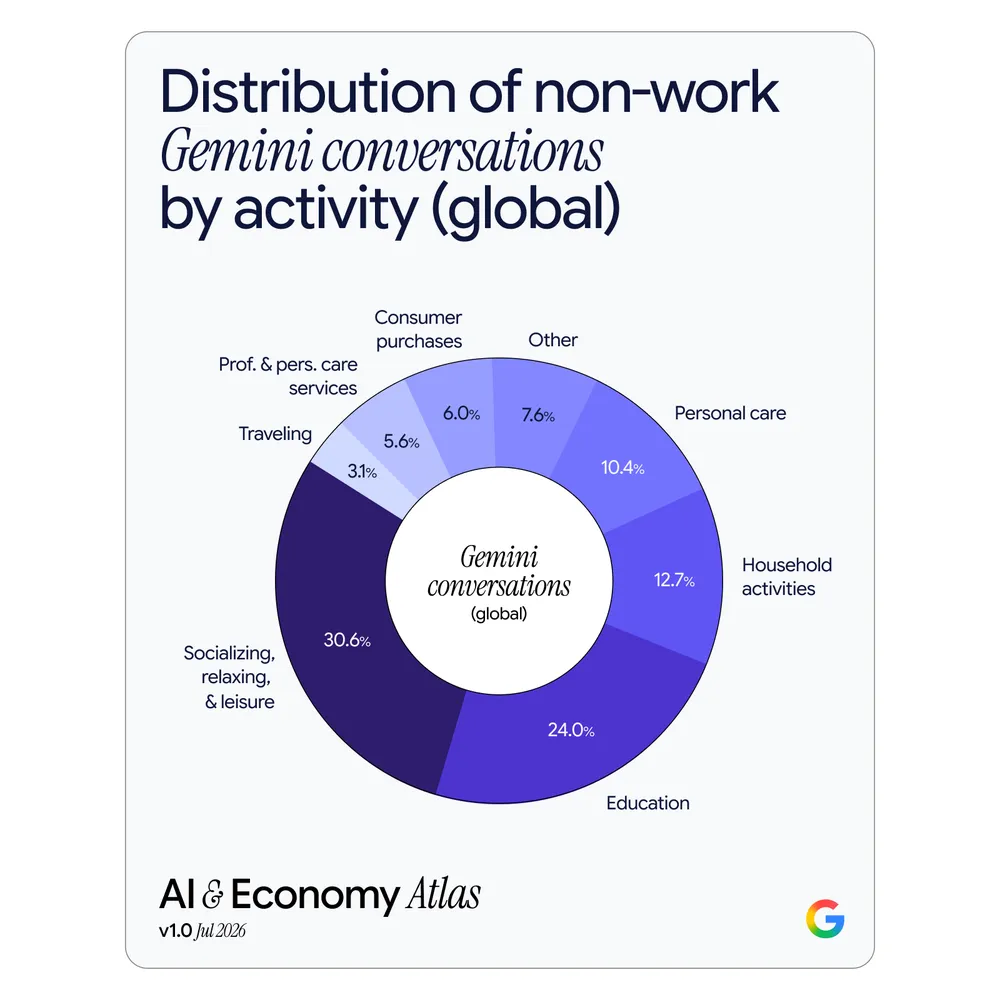
This isn't unique to Google. The paper cites OpenAI's own data: roughly 69% of ChatGPT interactions are also non-work. For the two largest conversational AI products, the main battleground is the home.
Why the most annoying errands get asked about the most
Knowing what people ask AI off the clock is only the first layer. The second is more revealing: divide a topic's share of AI conversations by its share of the time people actually spend on it.
The paper calls this ratio the over-indexing multipleA topic's share of AI conversations divided by its share of people's actual time. Above 1 means the topic gets asked about out of all proportion to the time it consumes.. Above 1 means a topic gets asked about more than its real weight in life; below 1, the reverse. The numbers:
The pattern is clean: the more a task involves forms, procedures, unreadable fine print, and taking time off to handle it, the more people ask AI. The paper counted the most frequent words in these conversation summaries; at the top sit "requirements," "compliance," and "process." That's exactly where people get stuck. Meanwhile eating, commuting, exercising, and caring for family — things that require a body in the room — get asked about far less than the time they consume.
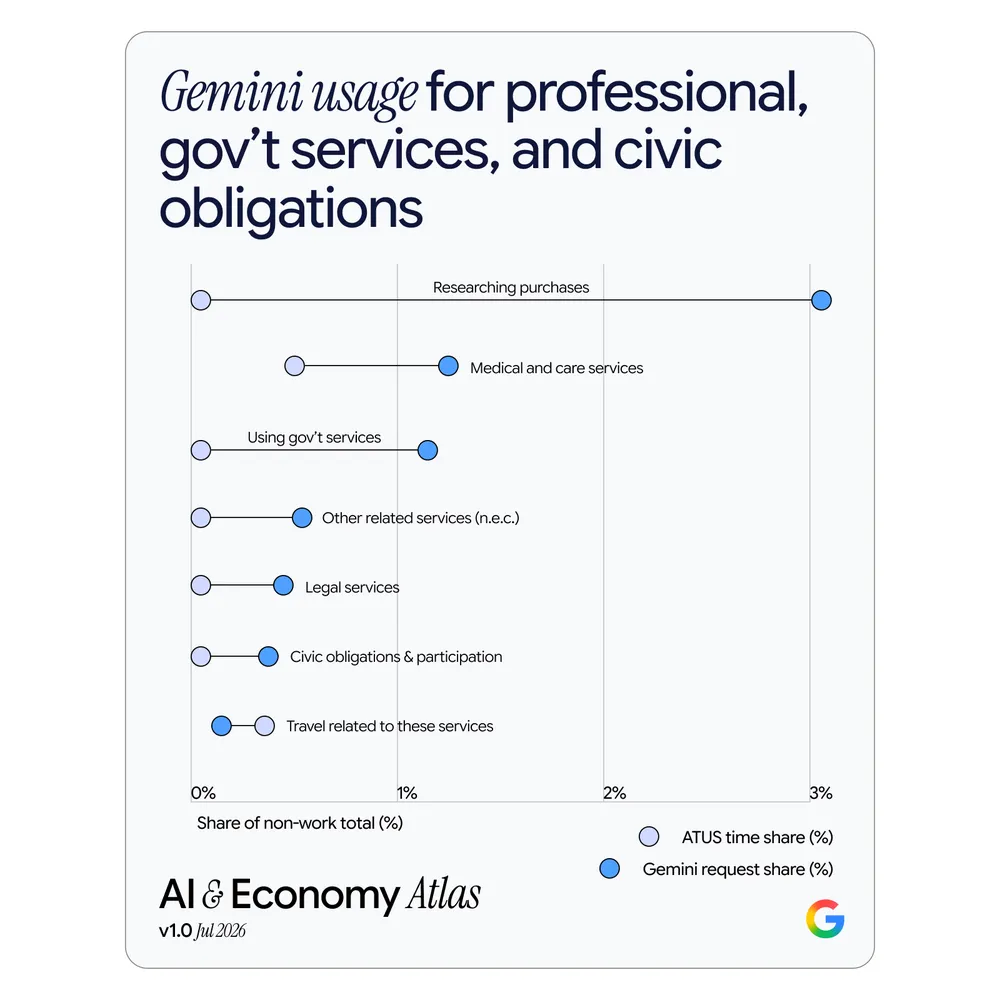
Break the government category apart and what dominates is obvious at a glance:
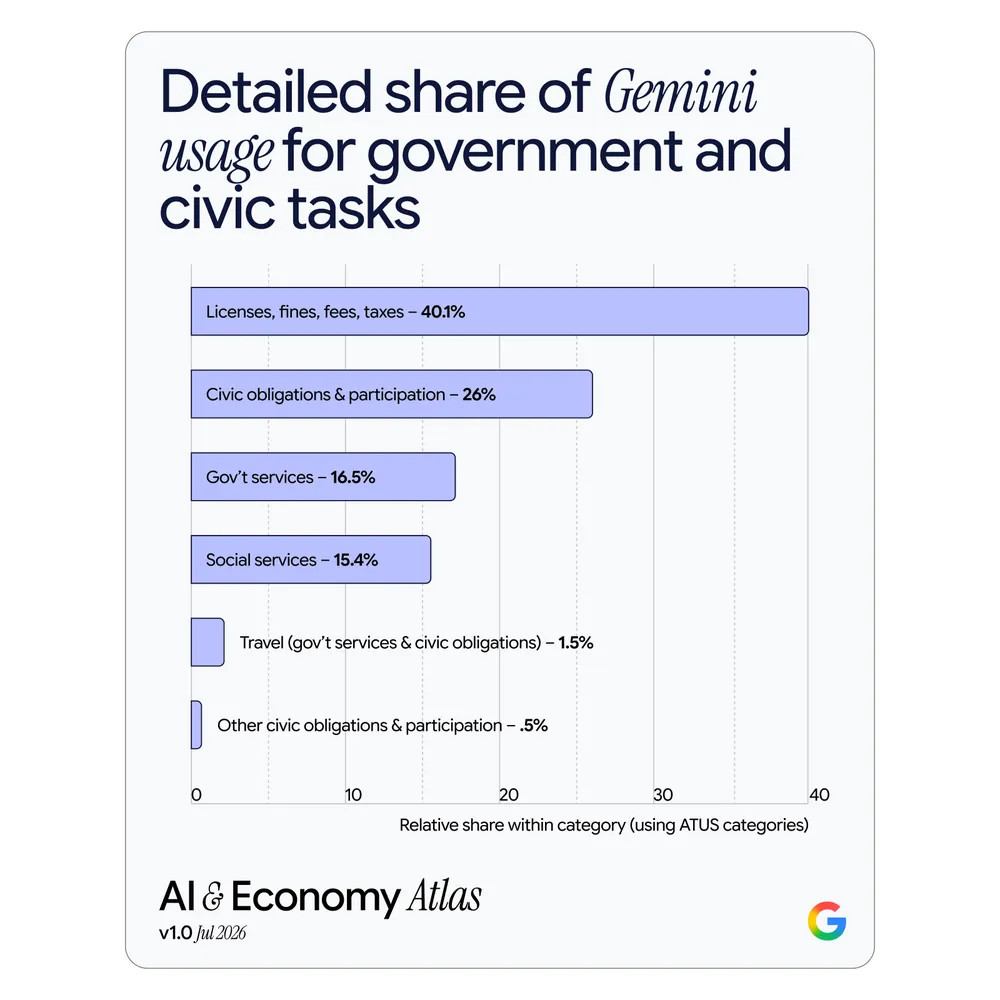
One more finding, on timing, explains the whole thing better: for medical, legal, financial, and government questions, roughly half happen outside nine-to-five — evenings, early mornings, weekends.
That number matters because handling any of it used to mean carving a block out of your workday. Half a day at a government office costs half a day's wages or half a day's output. That cost never appeared on any ledger, yet everyone paid it. Now part of it is gone. The paper's analogy: AI effectively keeps the government service window and the law office open around the clock.
None of this shows up in GDP
What is all that saved hassle — permits, doctors, paperwork — actually worth? The paper offers an estimate, and it's the estimate most likely to be mangled in the retelling, so the reasoning needs laying out.
First, a definition: GDP (gross domestic product) is the standard yardstick for the size of an economy, but it only counts transactions somebody paid for. Hire a cleaner and the money counts; do the same cleaning yourself and none of it does. Economists call this line the "production boundary": inside it counts, outside it doesn't.
Next, a standard: does a household chore count as productive labor? The test is the third-person criterionProposed by Reid in 1934: if you could in principle pay someone else to do it for you, it's productive activity (cooking, cleaning, childcare, repairs). If you can't (sleeping, watching a movie), it isn't.: could you pay someone else to do this for you? If yes, it counts; if not — sleeping, watching a movie — it doesn't. By that standard, Americans spend an average of 17.8 hours a week on productive housework.
Then comes the crucial step: nobody has measured how much time AI actually saves. The paper says so outright, so instead of measuring, it sets three scenarios and runs them against the official conservative replacement wage for that work ($12.02 an hour):
~5.4 min/week
~21 min/week
~53 min/week
These are if-then numbers, not measurements. The paper also cautions that measuring by time saved is itself flawed: much of what AI improves at home shows up as things getting done better, or done at all, rather than the same things taking less time.
Whichever scenario holds, one thing is certain: all of this lands on the unpaid side, outside the production boundary, where traditional GDP captures none of it. What it cuts is the time tax everyone pays in daily life and nobody ever books. Bringing Coyle in to review this research is itself a sign Google knew this section was the most exposed. What GDP as a yardstick leaves out is the question she has spent half a career on.
The paper closes with a line that's easy to skip: housework time has never been distributed evenly between genders. It doesn't run the numbers further, but both directions are plausible — women carry more of the load, so the absolute time saved could be larger; on the other hand, the heaviest AI use sits in high-paying jobs, where the housework burden is lighter to begin with. Who actually captures this time dividend is a question the data can't answer.
Usage tracks money worldwide, with a set of countries breaking the rule
Zoom out globally and the first regularity is that money and usage move nearly in lockstep: a 1% higher GDP per capita corresponds to about 0.9% higher AI usage per capita.
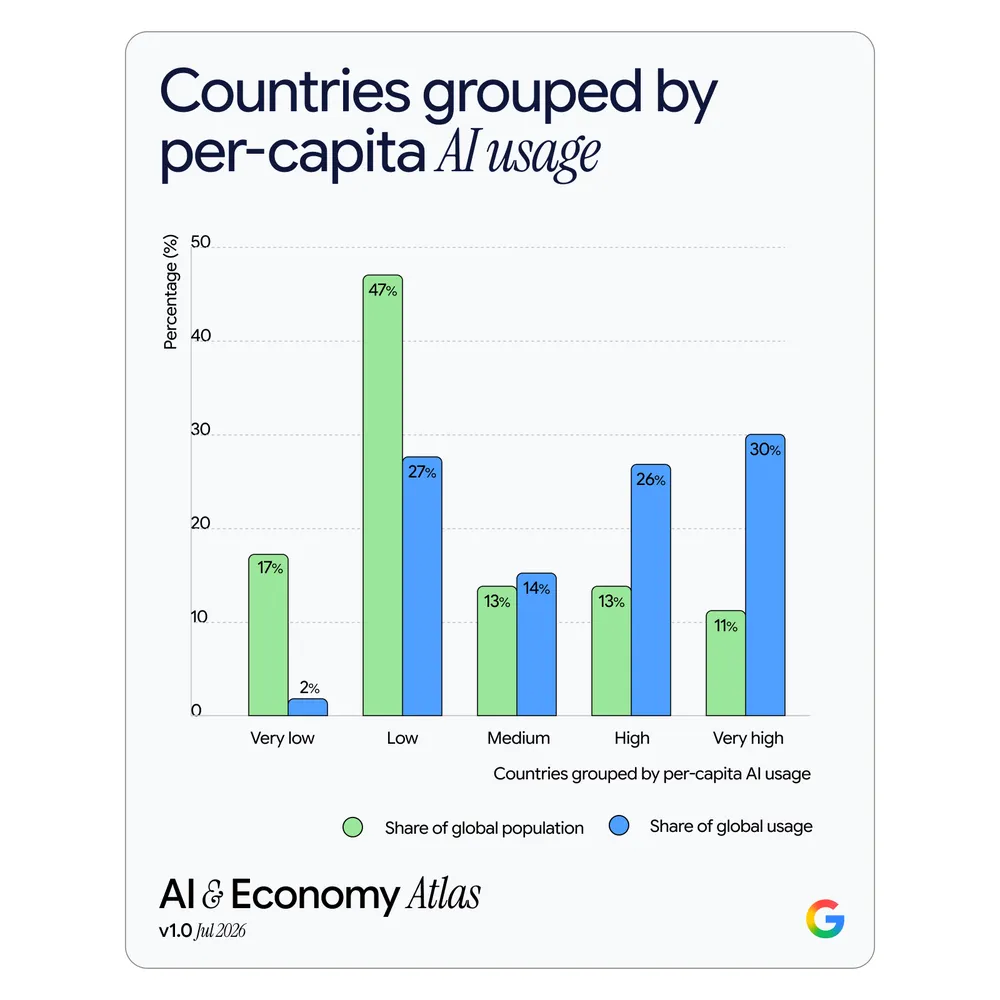
There is a clear set of exceptions. Turkey, the UAE, Qatar, and Israel all rank near the top, and the Middle East runs high generally. In South America, Chile, Peru, Brazil, Argentina, and Colombia reach the high and highest tiers, sitting alongside Western Europe. Going the other way, India and Russia — both large in population and in STEM graduates — land in the "low" tier.
Why? The paper's answer: no single factor explains it. It rules out at least two ready-made answers — the gaps persist after controlling for internet penetration, and interest in AI as a topic doesn't account for them either. What other possibilities remain untested, the paper neither measures nor lists. (Our note.) A few directions suggest themselves from the data: population age structure, the presence of a strong local competitor, how digitized government services are, and how well models handle the local language. There's sideways evidence for that last one in the next section.
The most interesting piece is the gap between interest and use. Rank countries by AI-related searches as a share of all local searches and the top tier is India, Bangladesh, Nepal, the Philippines, Indonesia, Thailand, and Vietnam, plus Kenya and Ethiopia in East Africa. The curiosity is there; the usage hasn't followed. Western Europe and Japan, meanwhile, rank in the lowest tier for search interest. The paper's explanation: in mature markets, AI has stopped being a novelty worth searching for and become background infrastructure in daily workflows.
China is not in this data. The paper notes that several countries and regions were excluded because the consumer products aren't accessible there; neither Gemini nor AI Mode in Google Search is offered in mainland China. So there are no China figures in the report, and the global picture it paints excludes Chinese usage entirely.
English is a third of it, and nobody switches to get better answers
143 languages cleared the privacy threshold, and English accounts for a little over a third. The remaining two-thirds spread across Spanish, Arabic, Portuguese, and a hundred-plus others. ATLAS covers more than 93% of native speakers of the world's 200 largest languages.
One widely held assumption gets overturned here. The assumption: since models answer better in English, users would switch to English for serious work and save their native language for everyday trivia. The actual data is almost symmetric: 26% of work usage is in a non-native language versus close to 24% for non-work, and 14% versus 13% looking at English alone. In every country, people switch languages at roughly the same rate on and off the clock.
The cost of switching is real, though: even comparing like for like, conversations in non-native English take 9–12% more turns and 18–20% more total tokens. That bill is paid jointly by the user's time and the provider's compute — and it hints at why the quality of native-language support shapes how much a region actually uses these tools.
How this differs from Anthropic's count
This comparison deserves its own section, because the two largest model providers, using their own data, tell noticeably different stories.
Anthropic's Economic Index uses a binary: a given use either augments a person or automates them. The 2025 edition came out at 57% augmentation versus 43% automation; the latest 2026 edition shifts to 52% versus 45% (with the remaining 3% fitting neither), meaning the automation share is rising over time. Google uses five categories and arrives at 6.5% end-to-end automation within non-routine cognitive work.
The paper does make one direct comparison, on the metric of "share of occupations with more than a quarter of their tasks covered by AI." Note this is not the 21% figure from earlier — this counts occupations, that one counted tasks within an occupation. On this metric ATLAS observes 30%, against Anthropic's 36% (2025) and 49% (combined across reports, 2026). Google notes in the same footnote that the sampling methods differ and that ATLAS applies stricter privacy processing, so the numbers aren't directly comparable.
The gap, then, is more likely an artifact of how each side counts than a real difference between their user bases. But the divergence in emphasis is genuine: one side stresses that collaboration dominates, the other that automation is climbing.
Which brings us back to the Solow paradox. ATLAS doesn't resolve it, but it sharpens the question: if much of AI's value lands on the unpaid side — helping you parse a benefits clause, work out how to get a permit, answer at 10 p.m. on a Sunday a question you'd otherwise have taken a day off to ask — then its absence from GDP may not mean it hasn't happened. More likely, the yardstick in our hands was never built to measure any of it.
Google counted 14.65 million real conversations: on thinking work, only 6.5% ask AI to do the whole job
Google mapped tens of millions of Gemini conversations onto official U.S. lists of occupations, tasks, and time use — the first real measurement of what people use AI for. Here it is in one page, with charts.
↓ one page · one chart animates
On July 23, 2026, Google published a study called ATLAS that does one thing: take 14.65 million real Gemini conversations and map each onto the U.S. government's official occupation list, task list, and time diaries, then count what people actually use AI for. Previous answers came from surveys and expert extrapolation. This one is measured.
Every number below comes from Google alone: its own product's conversations, measuring its own product's use, with no data or code released for outside replication. Diane Coyle of Cambridge and David Autor of MIT reviewed it.
The U.S. government splits work into 761 occupations, and 68% of them show someone using Gemini on the job. The list isn't just software engineers and market researchers — farmers, industrial mechanics, and foresters are on it too. Look one layer deeper, at how much of each job is actually covered, and the picture changes.
✔ Mechanics use it too: under the lift, photographing a seeping fitting to ask what's leaking. Automotive technicians send images at more than twice the rate of work conversations overall
✘ And 29% of occupations clear no threshold at all: stockers, assembly line workers, fast food cooks, refuse collectors, patrol officers
"Used a lot" and "replacing people" are different things, and three years of argument produced no data to separate them. Google trained a classifier to judge how far users wanted AI to go, across five levels, then applied it to different kinds of work. Within brain work, whether the task follows a playbook changes everything.
Strip out developers calling the API (98.8% of that is work) and, of the roughly 10 million everyday conversations people type themselves, only 13.5% relate to work; the other 86.5% happens off the clock. The next step is where it gets interesting: divide a topic's share of AI conversations by its share of the time people actually spend on it.
What's the saved hassle worth — the permits, the benefits questions, the fine print? It doesn't reach GDP (gross domestic product, the standard yardstick for the size of an economy), which only counts transactions somebody paid for: hire a cleaner and the money counts; clean it yourself and none of it does. Errand time saved falls squarely outside that line.
Nobody showed numbers.
Google counted
every one
farmers, mechanics, foresters included
- × Stockers and order fillers
- × Assembly line workers
- × Fast food cooks
- × Refuse collectors
- × Patrol officers
looking things up is 29.6%
that's all that asks AI
to do the whole job
the data can't say
calling the API and the rest
isn't about work at all
asked far beyond their weight in life
and government questions:
about half after hours
right outside that line
–$149B
scenarios for saving
0.5%–5% of that time.
Actual savings unmeasured
where it genuinely gets used is the errand pile you'd otherwise take a day off for.