a16z's charts: software stocks are getting sold off, but the market is only punishing the half with no moat
- Software stocks are down overall, but this is a selective sell-off: over the past 30 trading days, both the top quartile and the median company beat the software ETF — it's the bottom quartile, which includes some of the biggest names, dragging the average down.
- The market is now sorting software companies by "does this still have a moat in the AI era": cybersecurity, observability, and vertical SaaS sit up top; horizontal SaaS, cloud infrastructure, and "everything else" like ad tech get pushed to the bottom. Revenue growth barely correlates with recent stock performance.
- The cost of intelligence is falling far faster than PCs ever did: a price drop that took PCs over a decade now takes AI about three years — and the cheaper it gets, the more demand rises.
- There's barely any evidence AI is destroying jobs so far: 2026 summer internships, wages for young workers, and entry-level hiring are all rebounding — companies with high AI adoption actually added about 6 percentage points more entry-level hires two years out.
- Data centers and power prices move the opposite way from what you'd expect: the states where electricity demand is climbing fastest (Texas, Virginia) have barely seen price increases, while California and New York — where demand is falling — have seen the steepest price hikes.
Four "AI is going to wreck everything" claims, and the data tells a different story
a16z's "Charts of the Week" column just picked out four of today's most popular fears and laid nearly 20 data charts against them: software companies are about to get wiped out by AI, cheap models will undercut the frontier labs, AI is stealing people's jobs, and data centers are driving up your electricity bill.
Software stocks are down, but the market is only punishing the moat-less half
Software companies are having a rough stretch. But this sell-off is selective, not an indiscriminate bloodbath.
Start with how pessimistic the market actually is.
That multiple for software companies has fallen back to, or below, 2014 levels. The premium investors are willing to pay for software's cash-generating ability has dropped to its lowest point in over a decade.
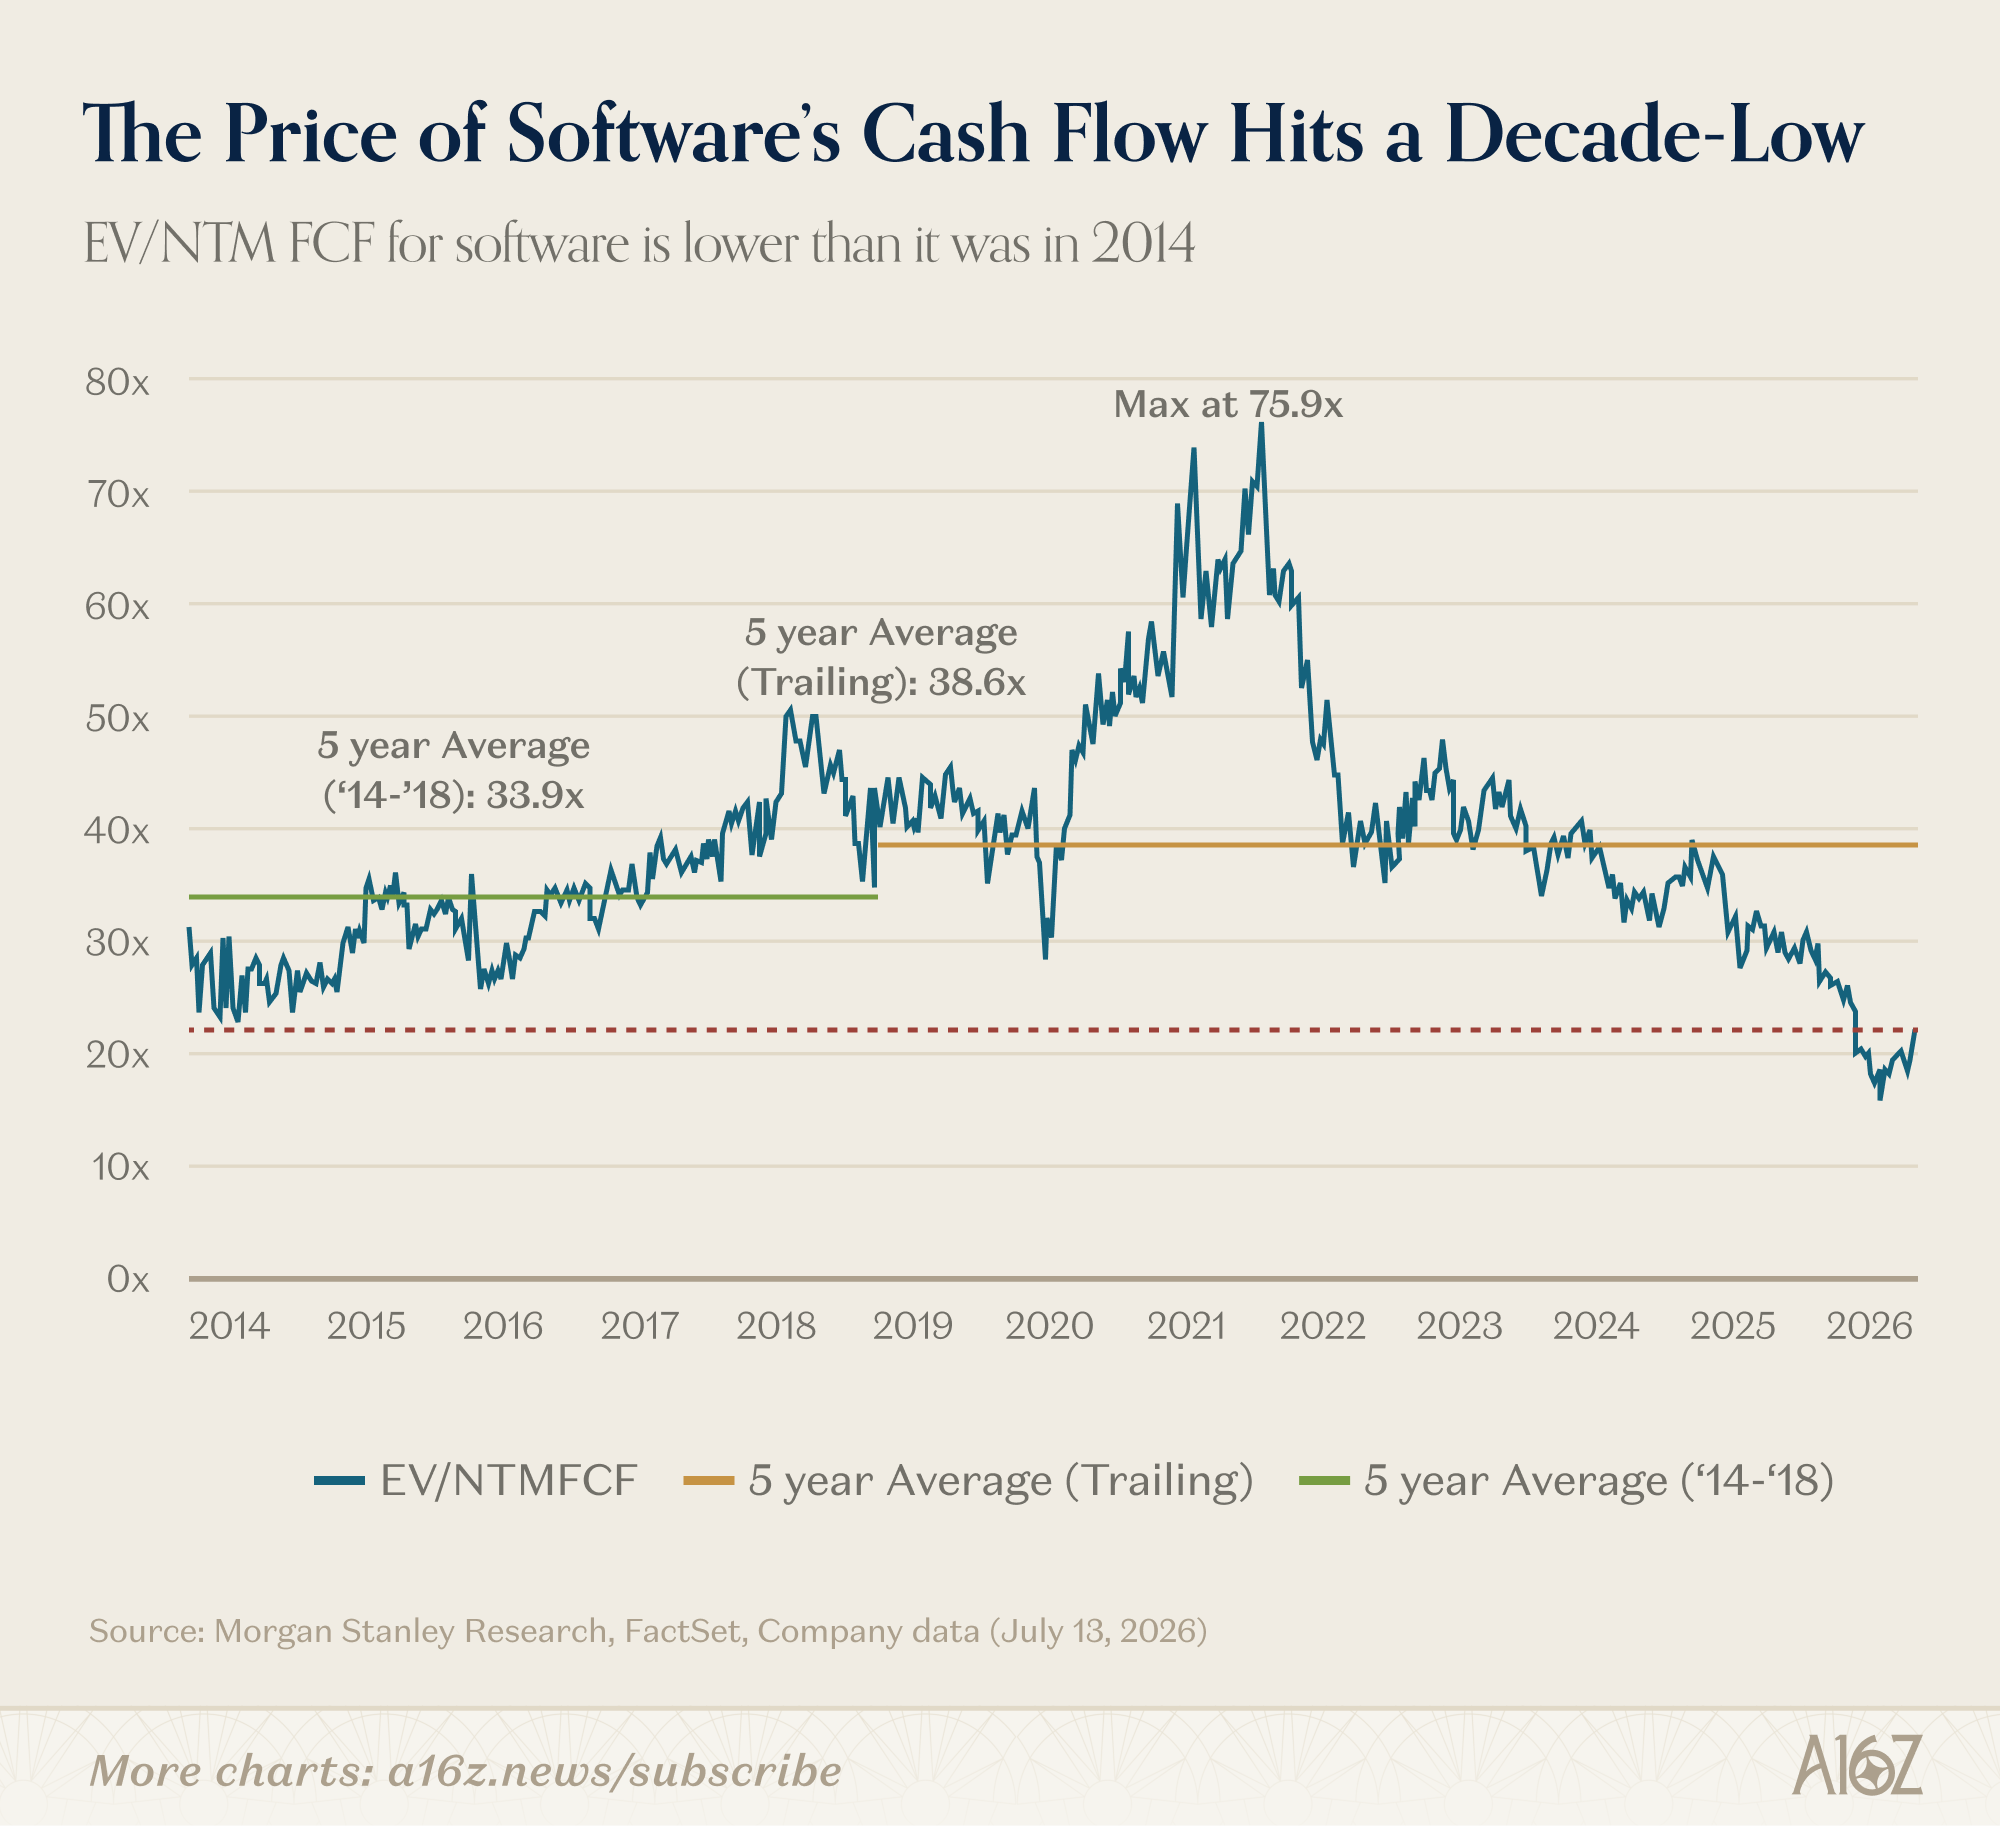
But what's being sold off isn't "now." These companies' current performance is actually holding up fine — the market is worried about whether it'll still hold up a year from now. This is an AI-disruption story. Newspaper stocks, too, started falling long before earnings actually collapsed — and in hindsight, the investors who got out early called it right.
And it's not a uniform decline either. Rank software companies by recent performance and split them into four quartiles, and the picture splits apart.
Over the past 30 trading days, both the top-25% quartile and the median company beat the overall software ETF. What actually dragged the average down was the bottom 25% — and that's where some of the sector's biggest names sit.
Zoom out to a full year and the median company basically tracks the ETF — the quartiles only started diverging around the start of this year. Since then, the gap between top and bottom has widened to roughly 50 percentage points.
What's more telling: how fast a company's revenue is growing barely correlates with its recent stock performance. A cluster of companies growing revenue in the 15%–20%-plus range are scattered almost vertically on performance; some of the fastest-growing, largest companies land in the worst-performing tier. What the market actually cares about is something else: whether this company's business can hold up in the AI era.
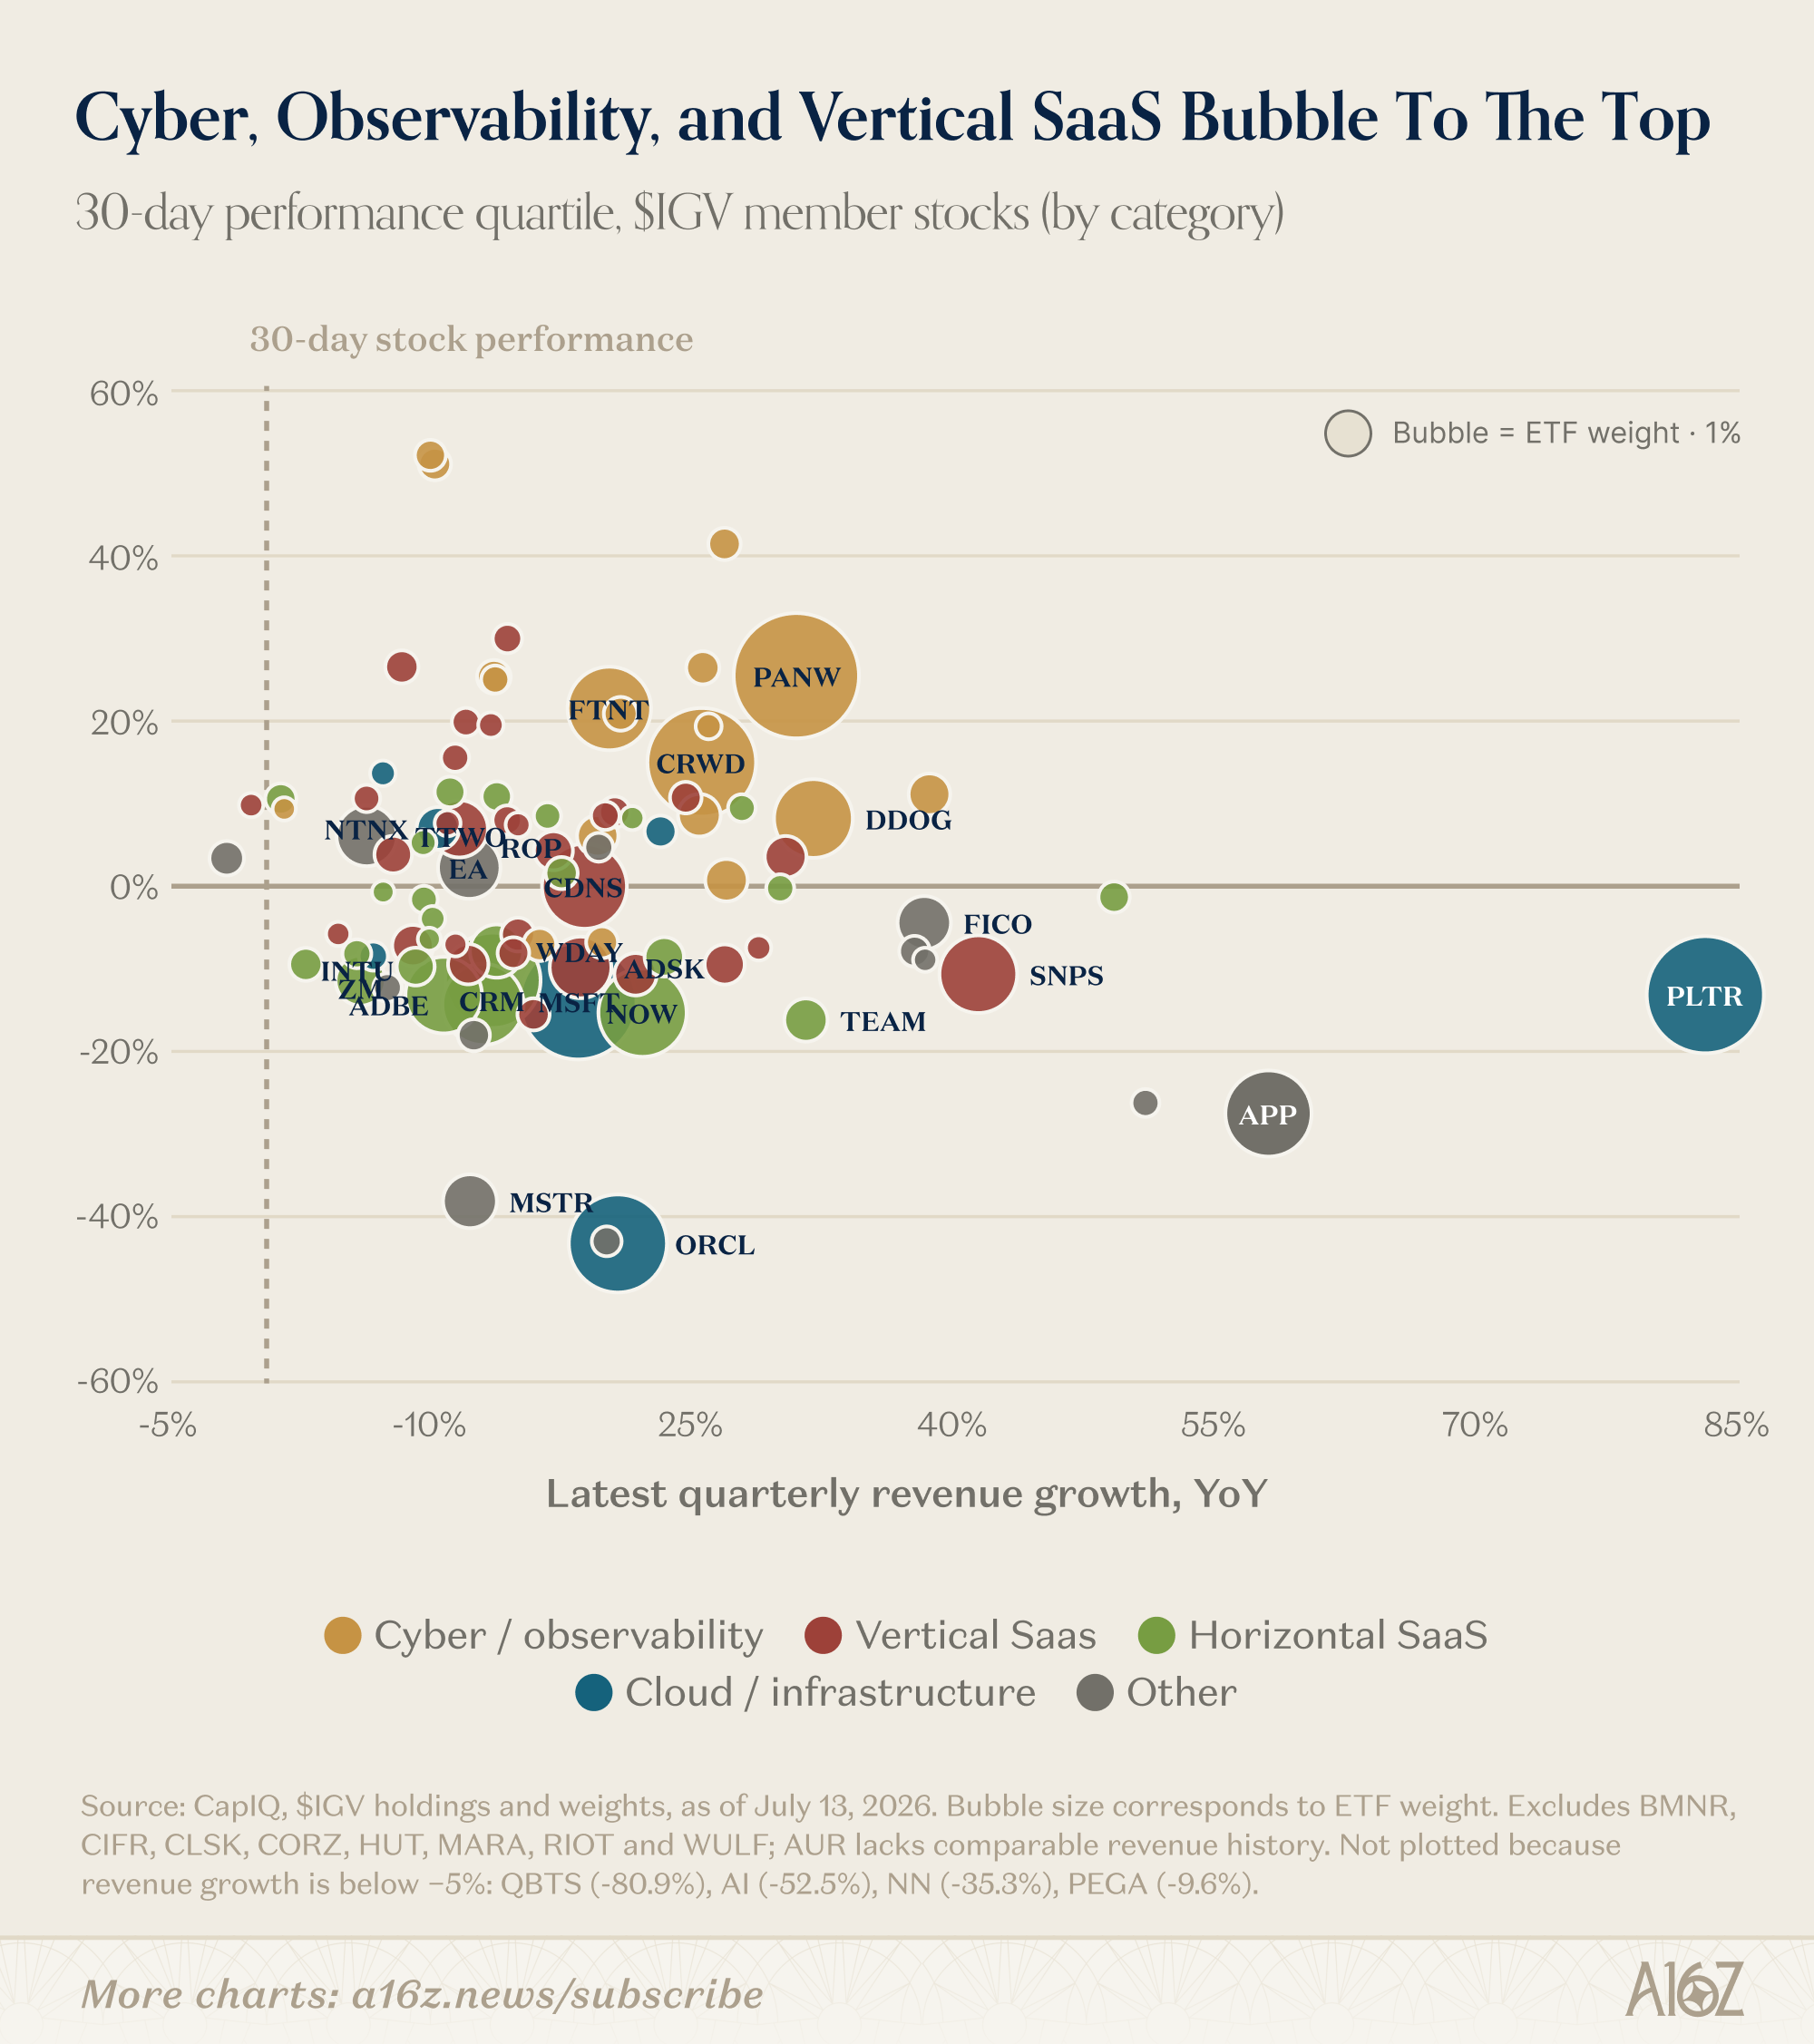
The logic behind this split isn't complicated.
For cybersecurity and observability companies, AI is thought to make buyers more urgent to spend, and incumbents carry a "trust premium" that's hard for AI challengers to dislodge. Vertical SaaS companies hold onto industry-specific workflows, proprietary data, and customer relationships — none of which an AI challenger can easily route around. General-purpose horizontal platforms don't have that layer of protection.
For everyone else, the conclusion is simple: software alone no longer counts as a moat. Years of accumulated subscription revenue, a sprawling feature set, a broad user base — all of that is now old news. A few quarters of stabilized or resurgent growth might rewrite the script, but for now, the market isn't buying it.
Intelligence keeps getting cheaper, and people are using more of it, not less
There's a theory going around: AI usage is shifting from "use the biggest, most expensive model" to "save wherever you can." Frontier models keep getting pricier, but the marginal improvement they offer may not be worth paying extra for — so customers who can downgrade are downgrading, moving to cheaper, less capable models, including open-weight models they can download and run themselves.
Follow that worry to its logical end: if customers won't pay up for the newest and strongest models, how do the labs burning cash to train frontier models keep going? This issue doesn't wade into that debate directly — it just points to one fact: the cost of intelligence is falling fast, and that looks like good news for AI demand. This is the Jevons effect, straight out of economics.
A more fuel-efficient car makes driving cheaper. So people drive more, go farther, and total fuel consumption across society rises instead of falls. Cheaper intelligence follows the same path: as the unit cost drops, both the number of users and the number of use cases climb together.
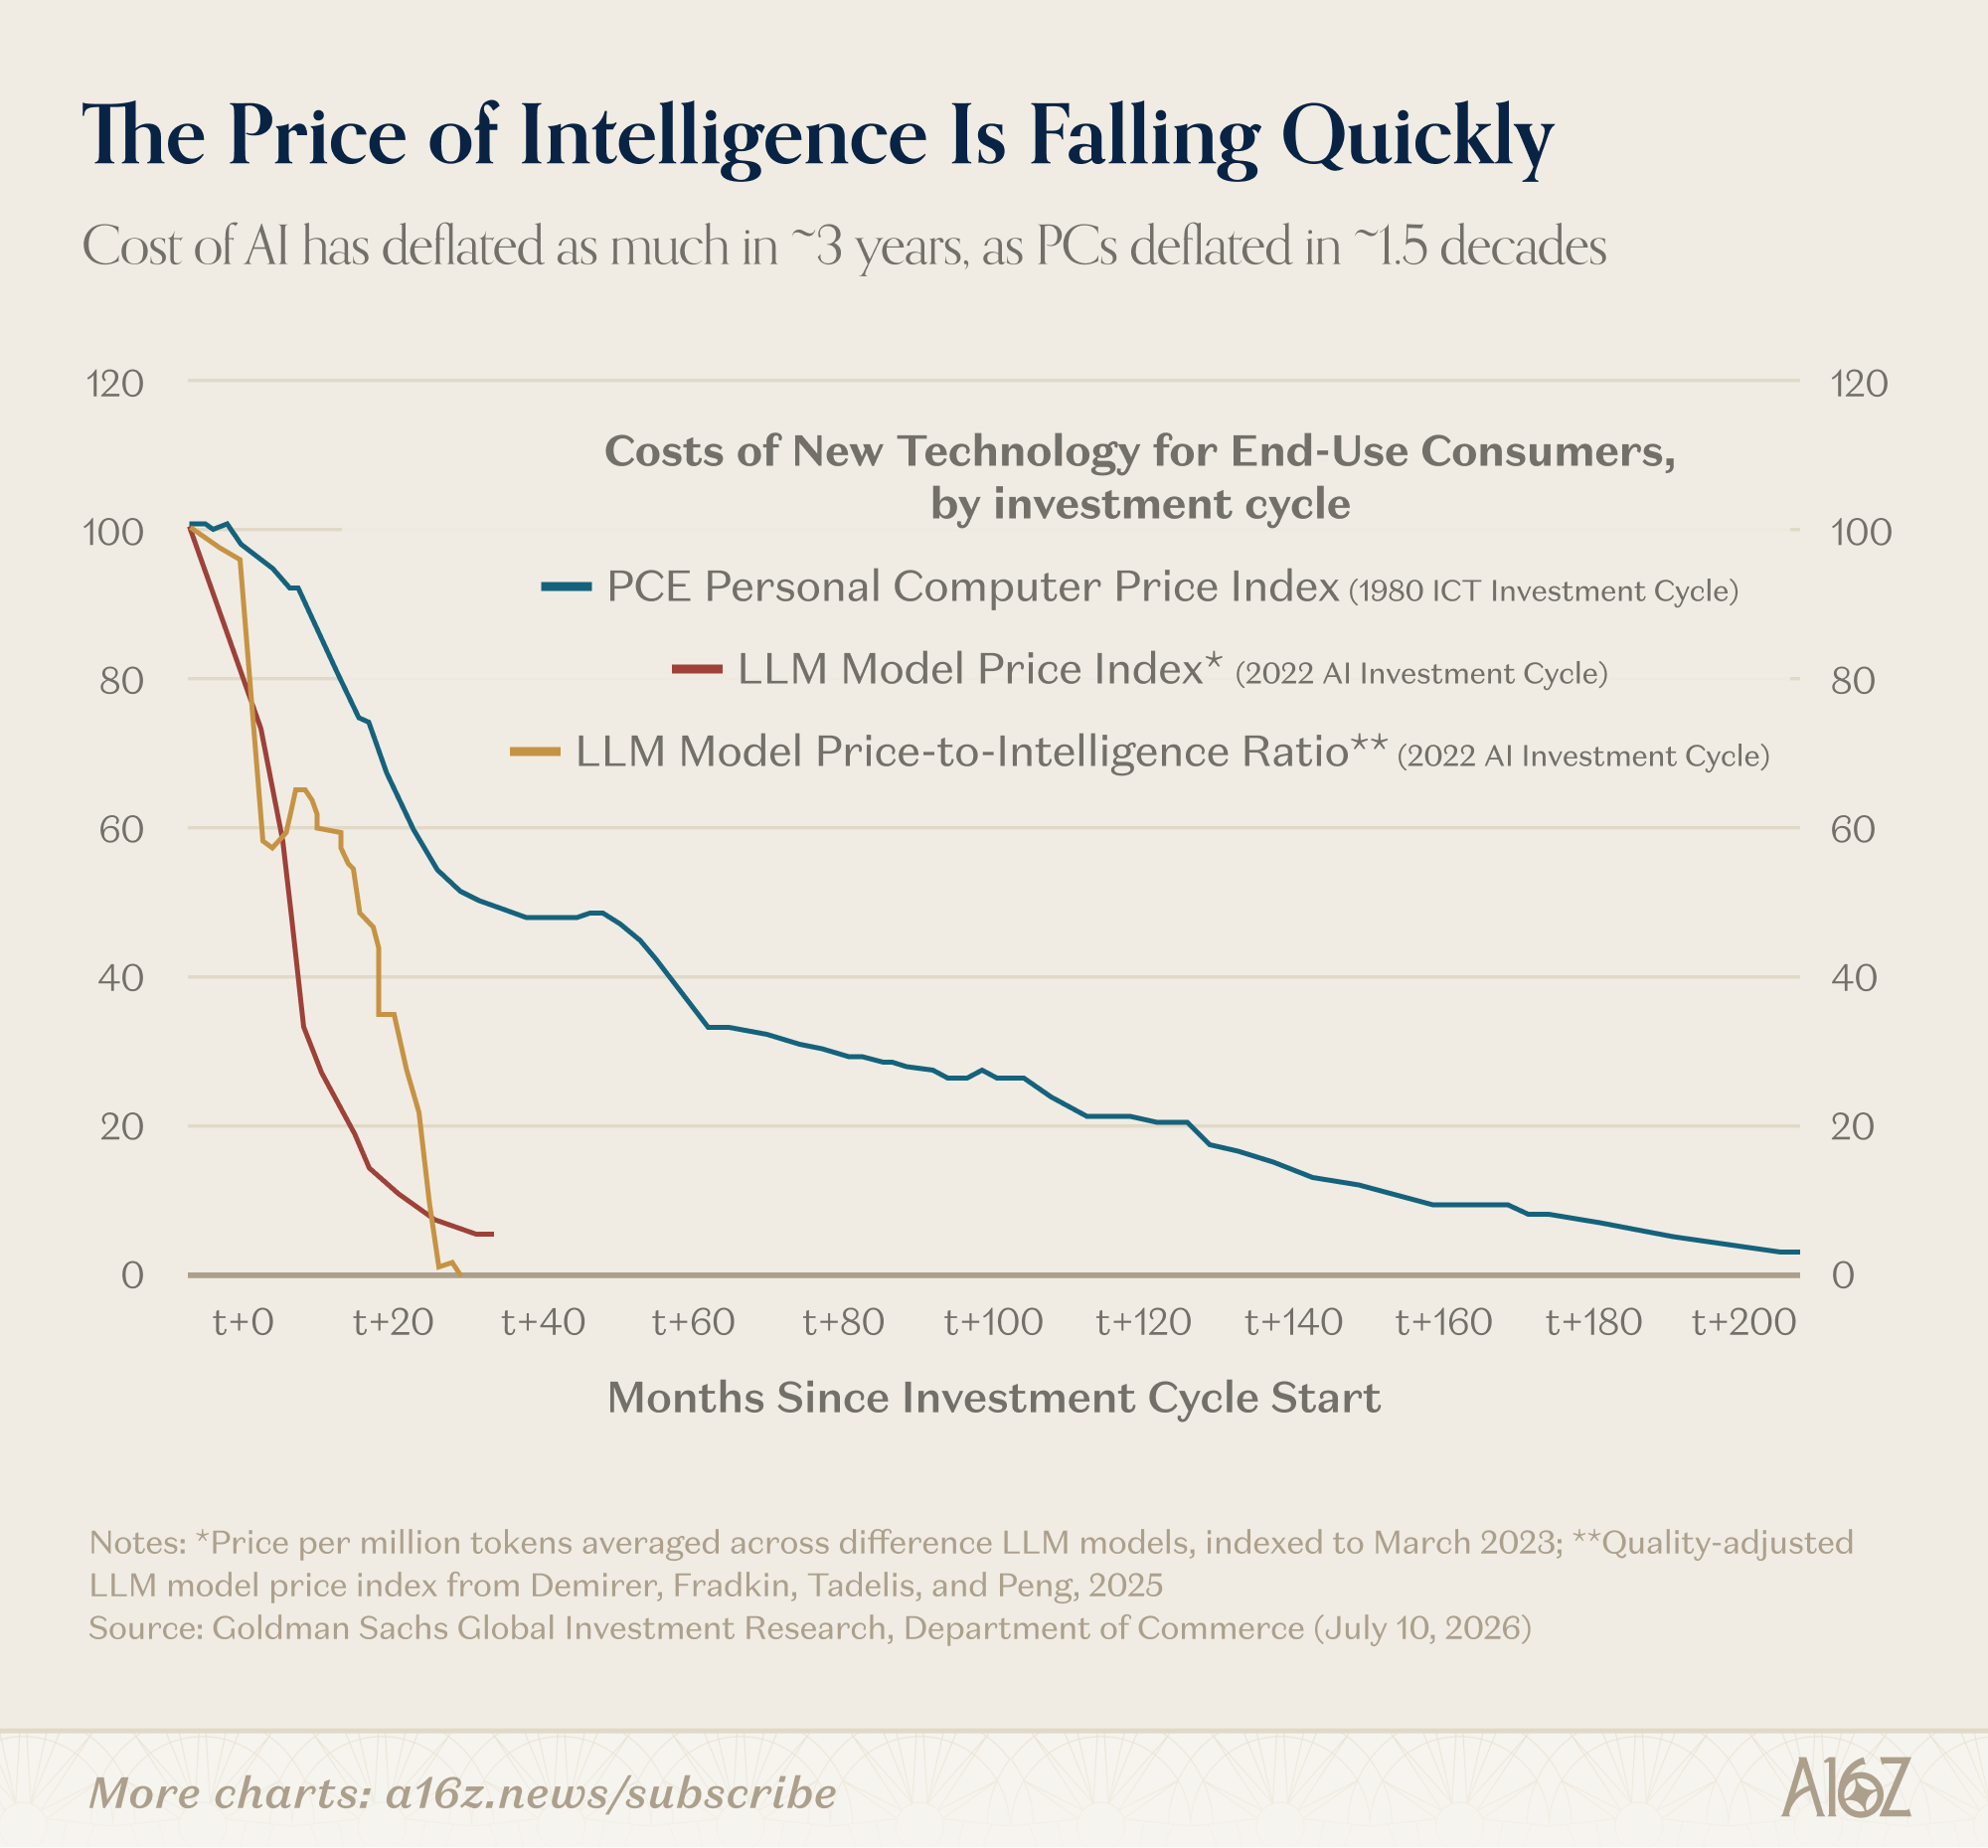
Compare it against another technology that went from expensive and scarce to cheap and ubiquitous: the PC. The cost of intelligence is falling far faster than the PC's did — a price decline that took the PC over a decade is happening for AI in roughly three years.
Demand is rising to match. The share of households paying for AI is still small, but it's climbing — average monthly spend is up about 25% year-to-date, growing faster than the number of paying households itself.
A rough point of reference: in 1997, only about 45% of adults aged 35 to 54 owned a computer — and that was already years into commercial PC adoption. Today, roughly 90% of US households own a computer, and nearly 97% counting smartphones. Mass adoption always takes time, climbing alongside usefulness and falling cost. AI's household payment penetration is only 2.2% right now, which leaves plenty of room to grow.
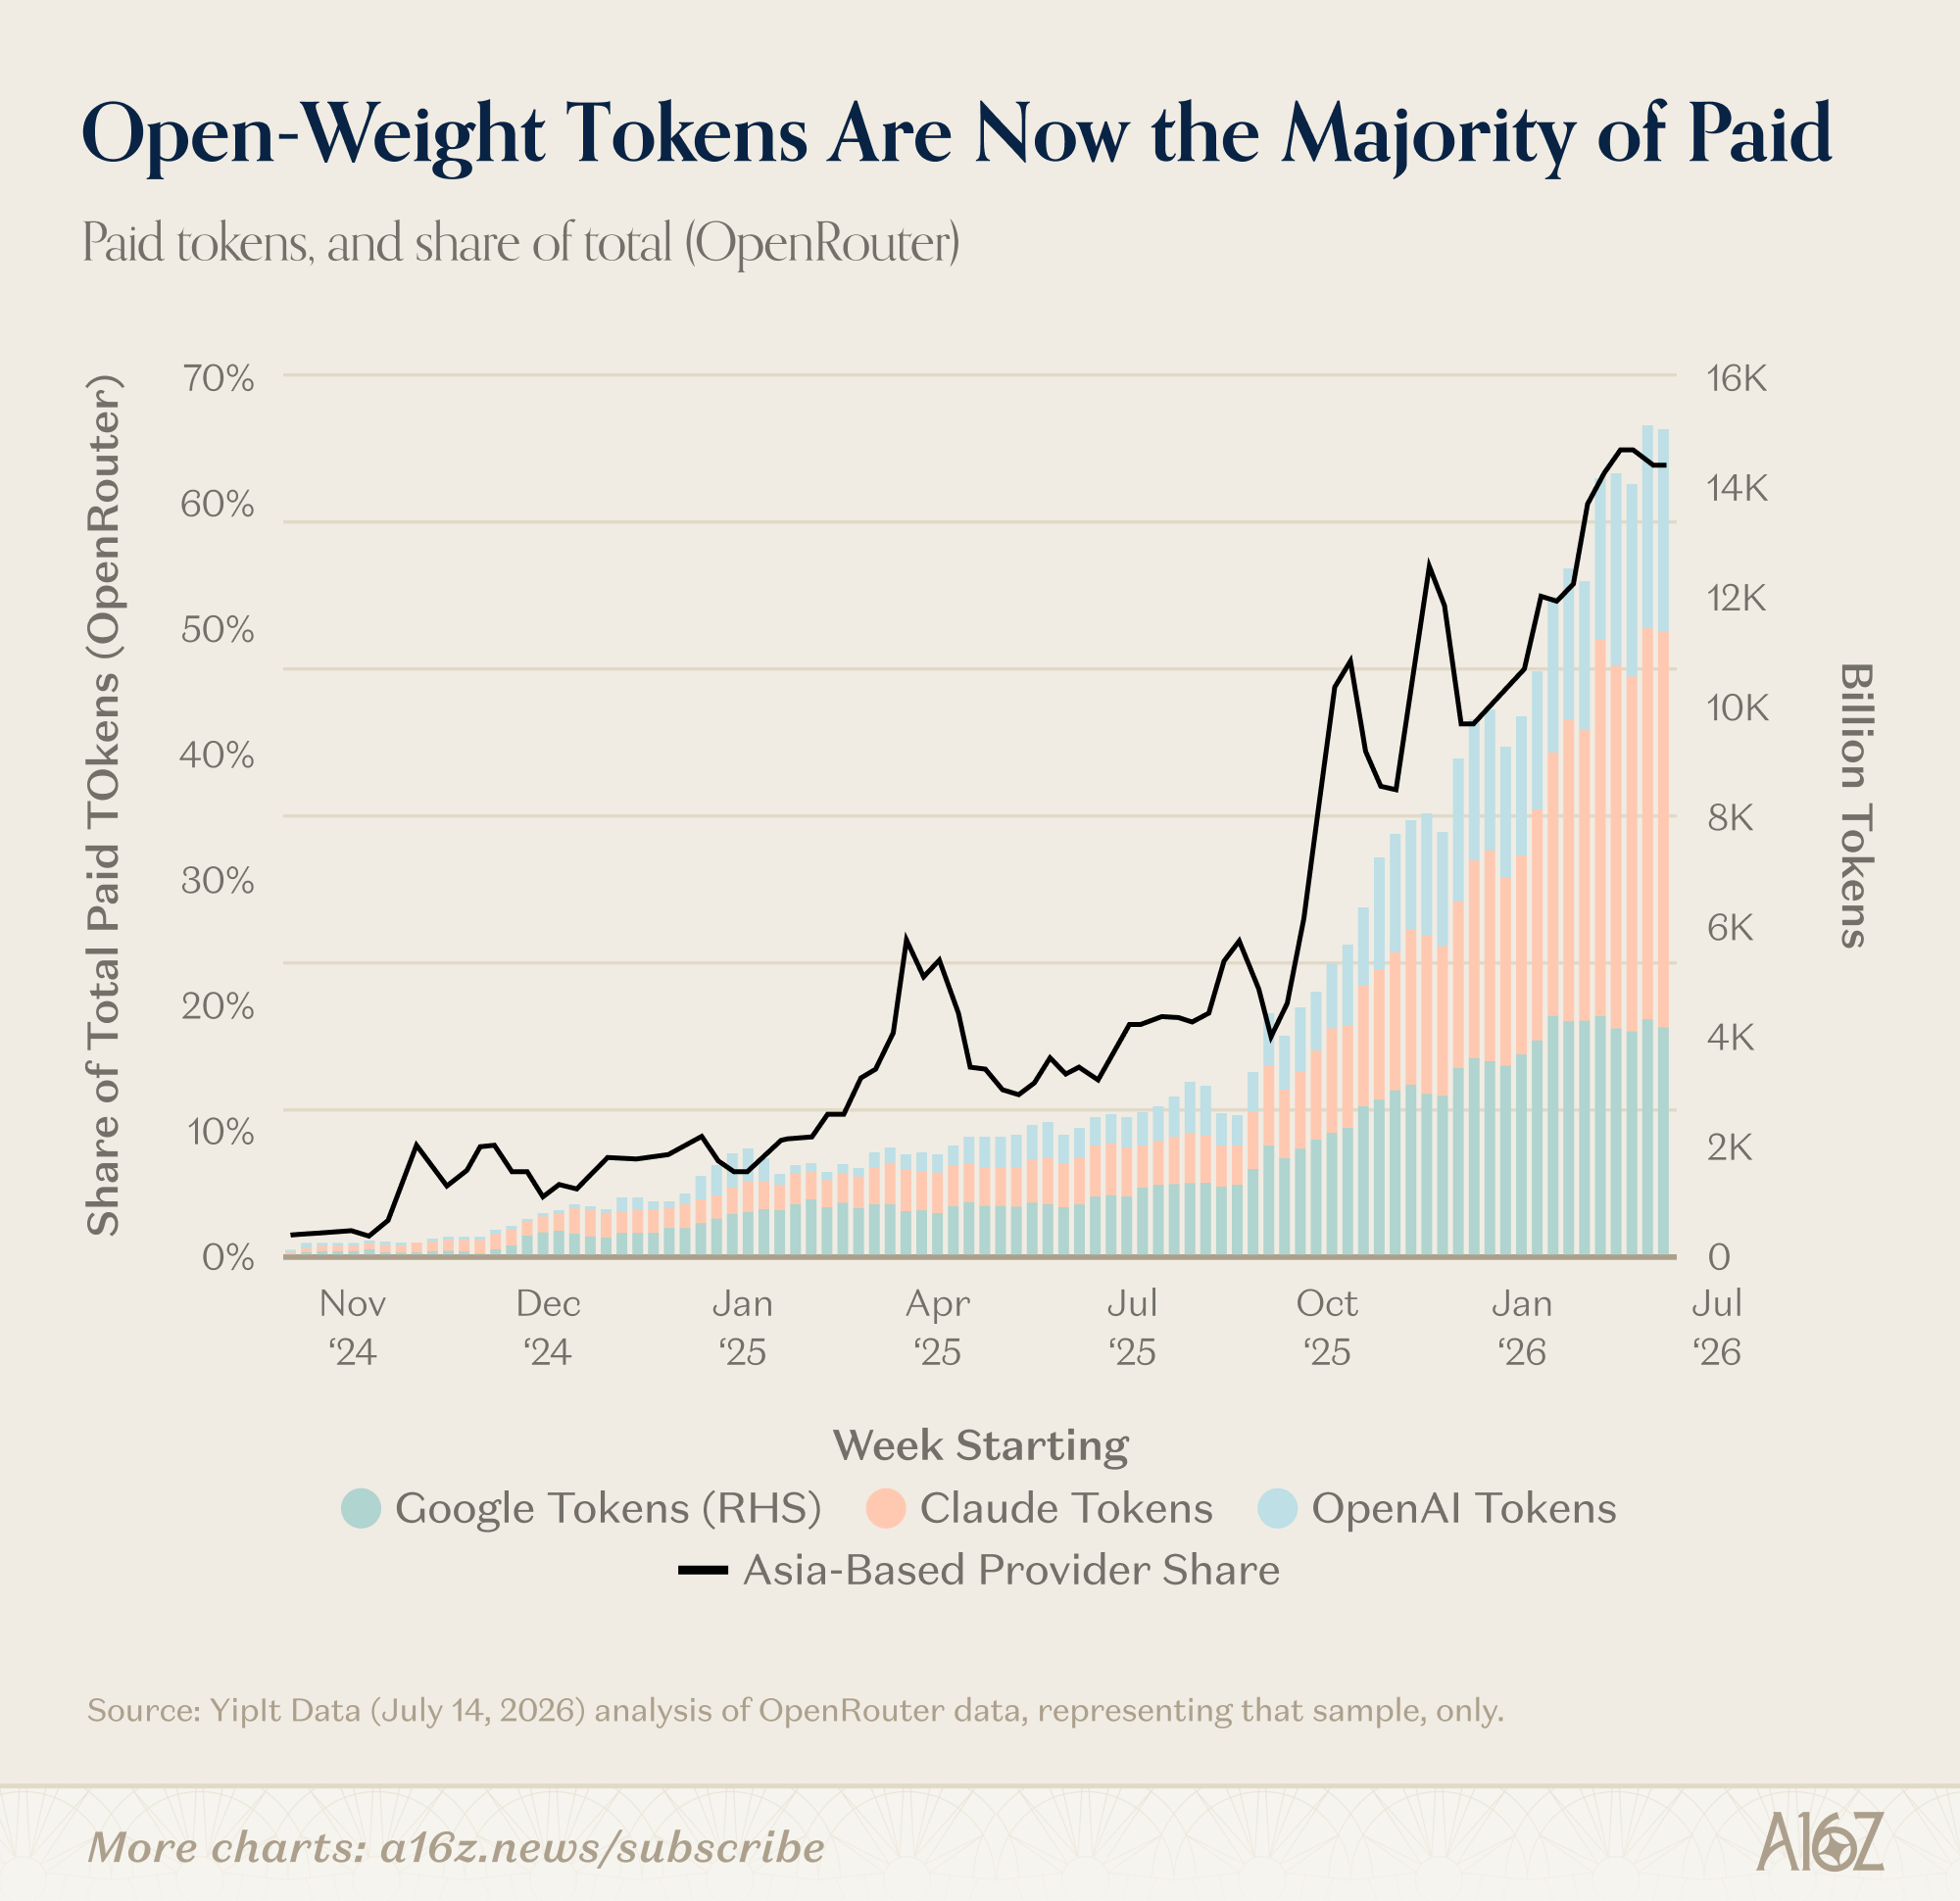
Another data set comes from YipitData's analysis of OpenRouter, which only captures a slice of total token consumption: frontier model token usage keeps rising, while open-weight models are gaining share fast too — "Asian suppliers," used here as a proxy for open-weight adoption, have climbed to roughly 60% share. (There's no way to directly track who's using open-weight models, so Asian-supplier share stands in as an approximation.)
Also from OpenRouter: per-user token usage and per-user spend have both been climbing fast this year, but usage is climbing much faster than spend. People are using more and paying more — it's just that the usage curve is steeper, which is exactly what the Jevons effect looks like.
Cheaper second-tier models really are taking share, but the net effect is pushing total spend up exponentially. The scenario that would actually resemble a doomsday script is a different one: efficiency gains that have zero effect on demand, or even shrink total spend. And that's exactly what hasn't happened.
Is AI stealing jobs? The data says not yet
There's a contradictory pair of claims about AI: one says it's useless and can't deliver real returns, the other says it's so powerful it's about to wipe out every job. So far, there's almost no evidence AI is destroying jobs at scale.
Even the labor market's most vulnerable spot — entry-level hiring — shows signs of warming up recently, and AI looks like it's helping far more than it's hurting.
Two signals: 2026 summer internships are notably higher than in prior years, well ahead of both 2025 and 2024 (though still short of 2023); wage growth for 16-to-24-year-olds has also bounced back from its 2025 trough. Rising wages usually signal an improving outlook for entry-level jobs too.
Cross-referencing hiring data with corporate spending data sharpens the picture.
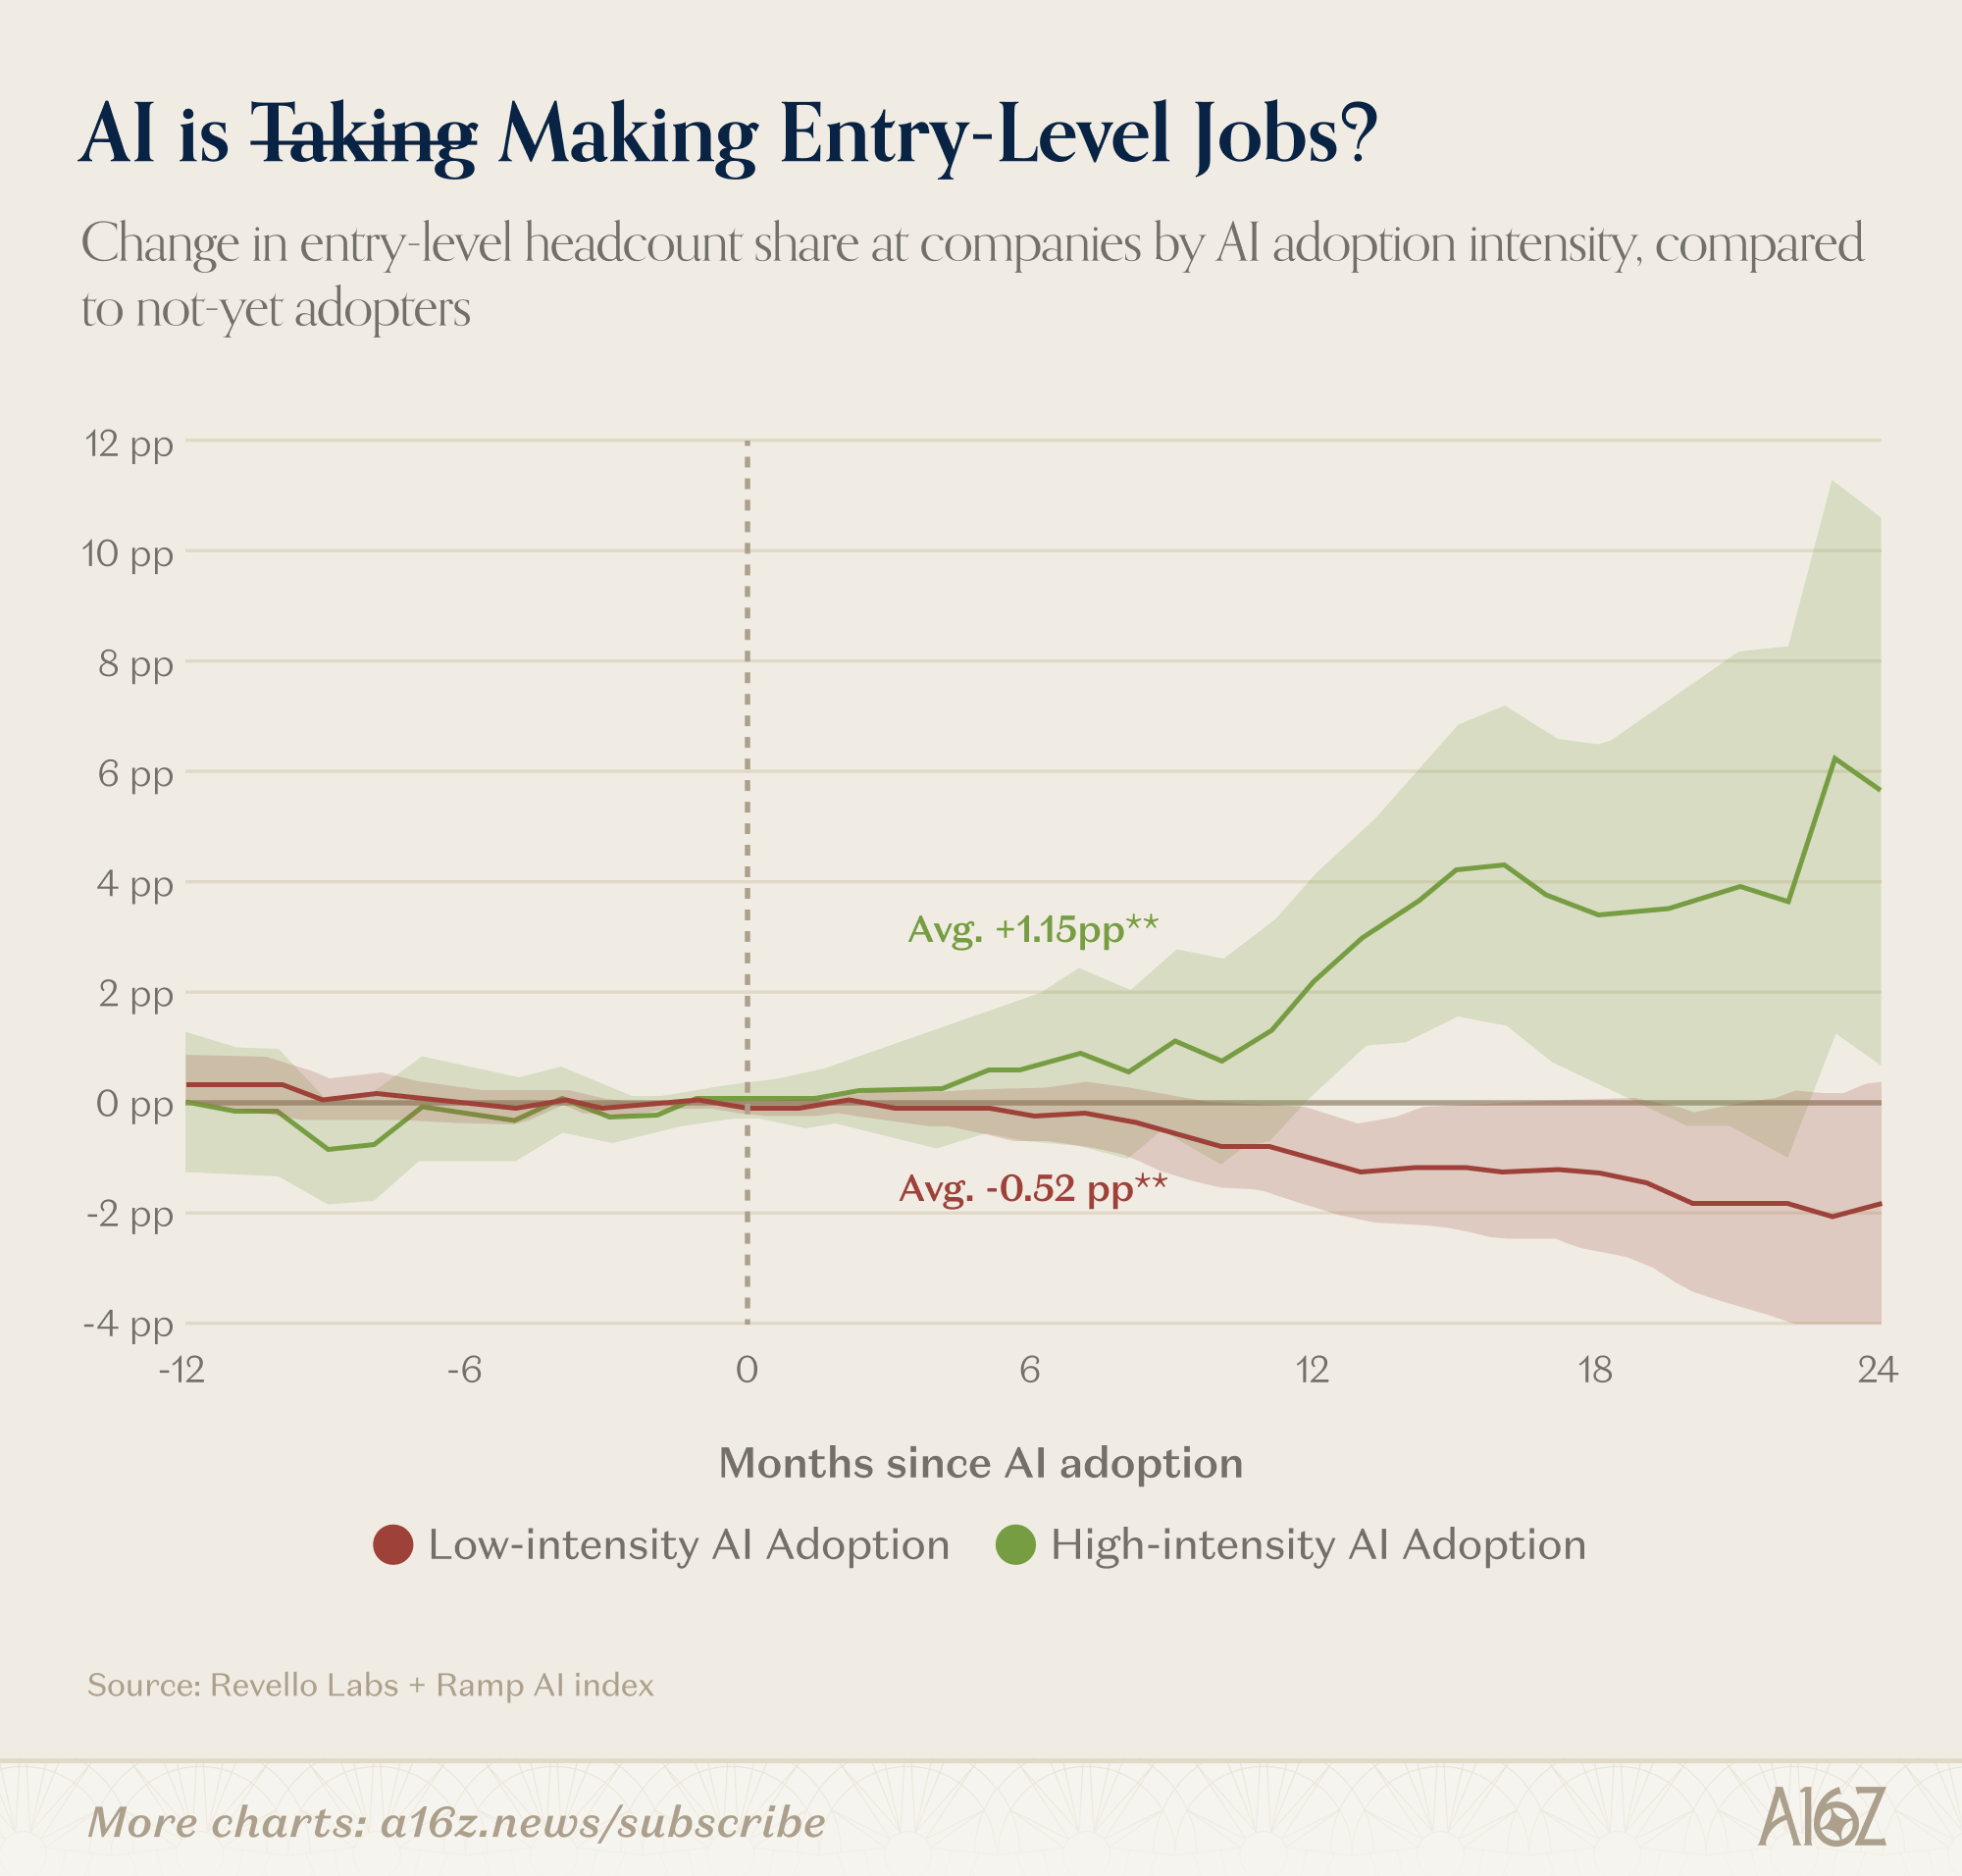
This chart supports several readings: maybe AI is creating entry-level jobs; maybe the companies adopting AI were already growth companies that hire a lot anyway; maybe Ramp's sample isn't representative of the broader economy and proves nothing. All of those hold up. But one reading almost certainly doesn't: that AI is destroying entry-level jobs.
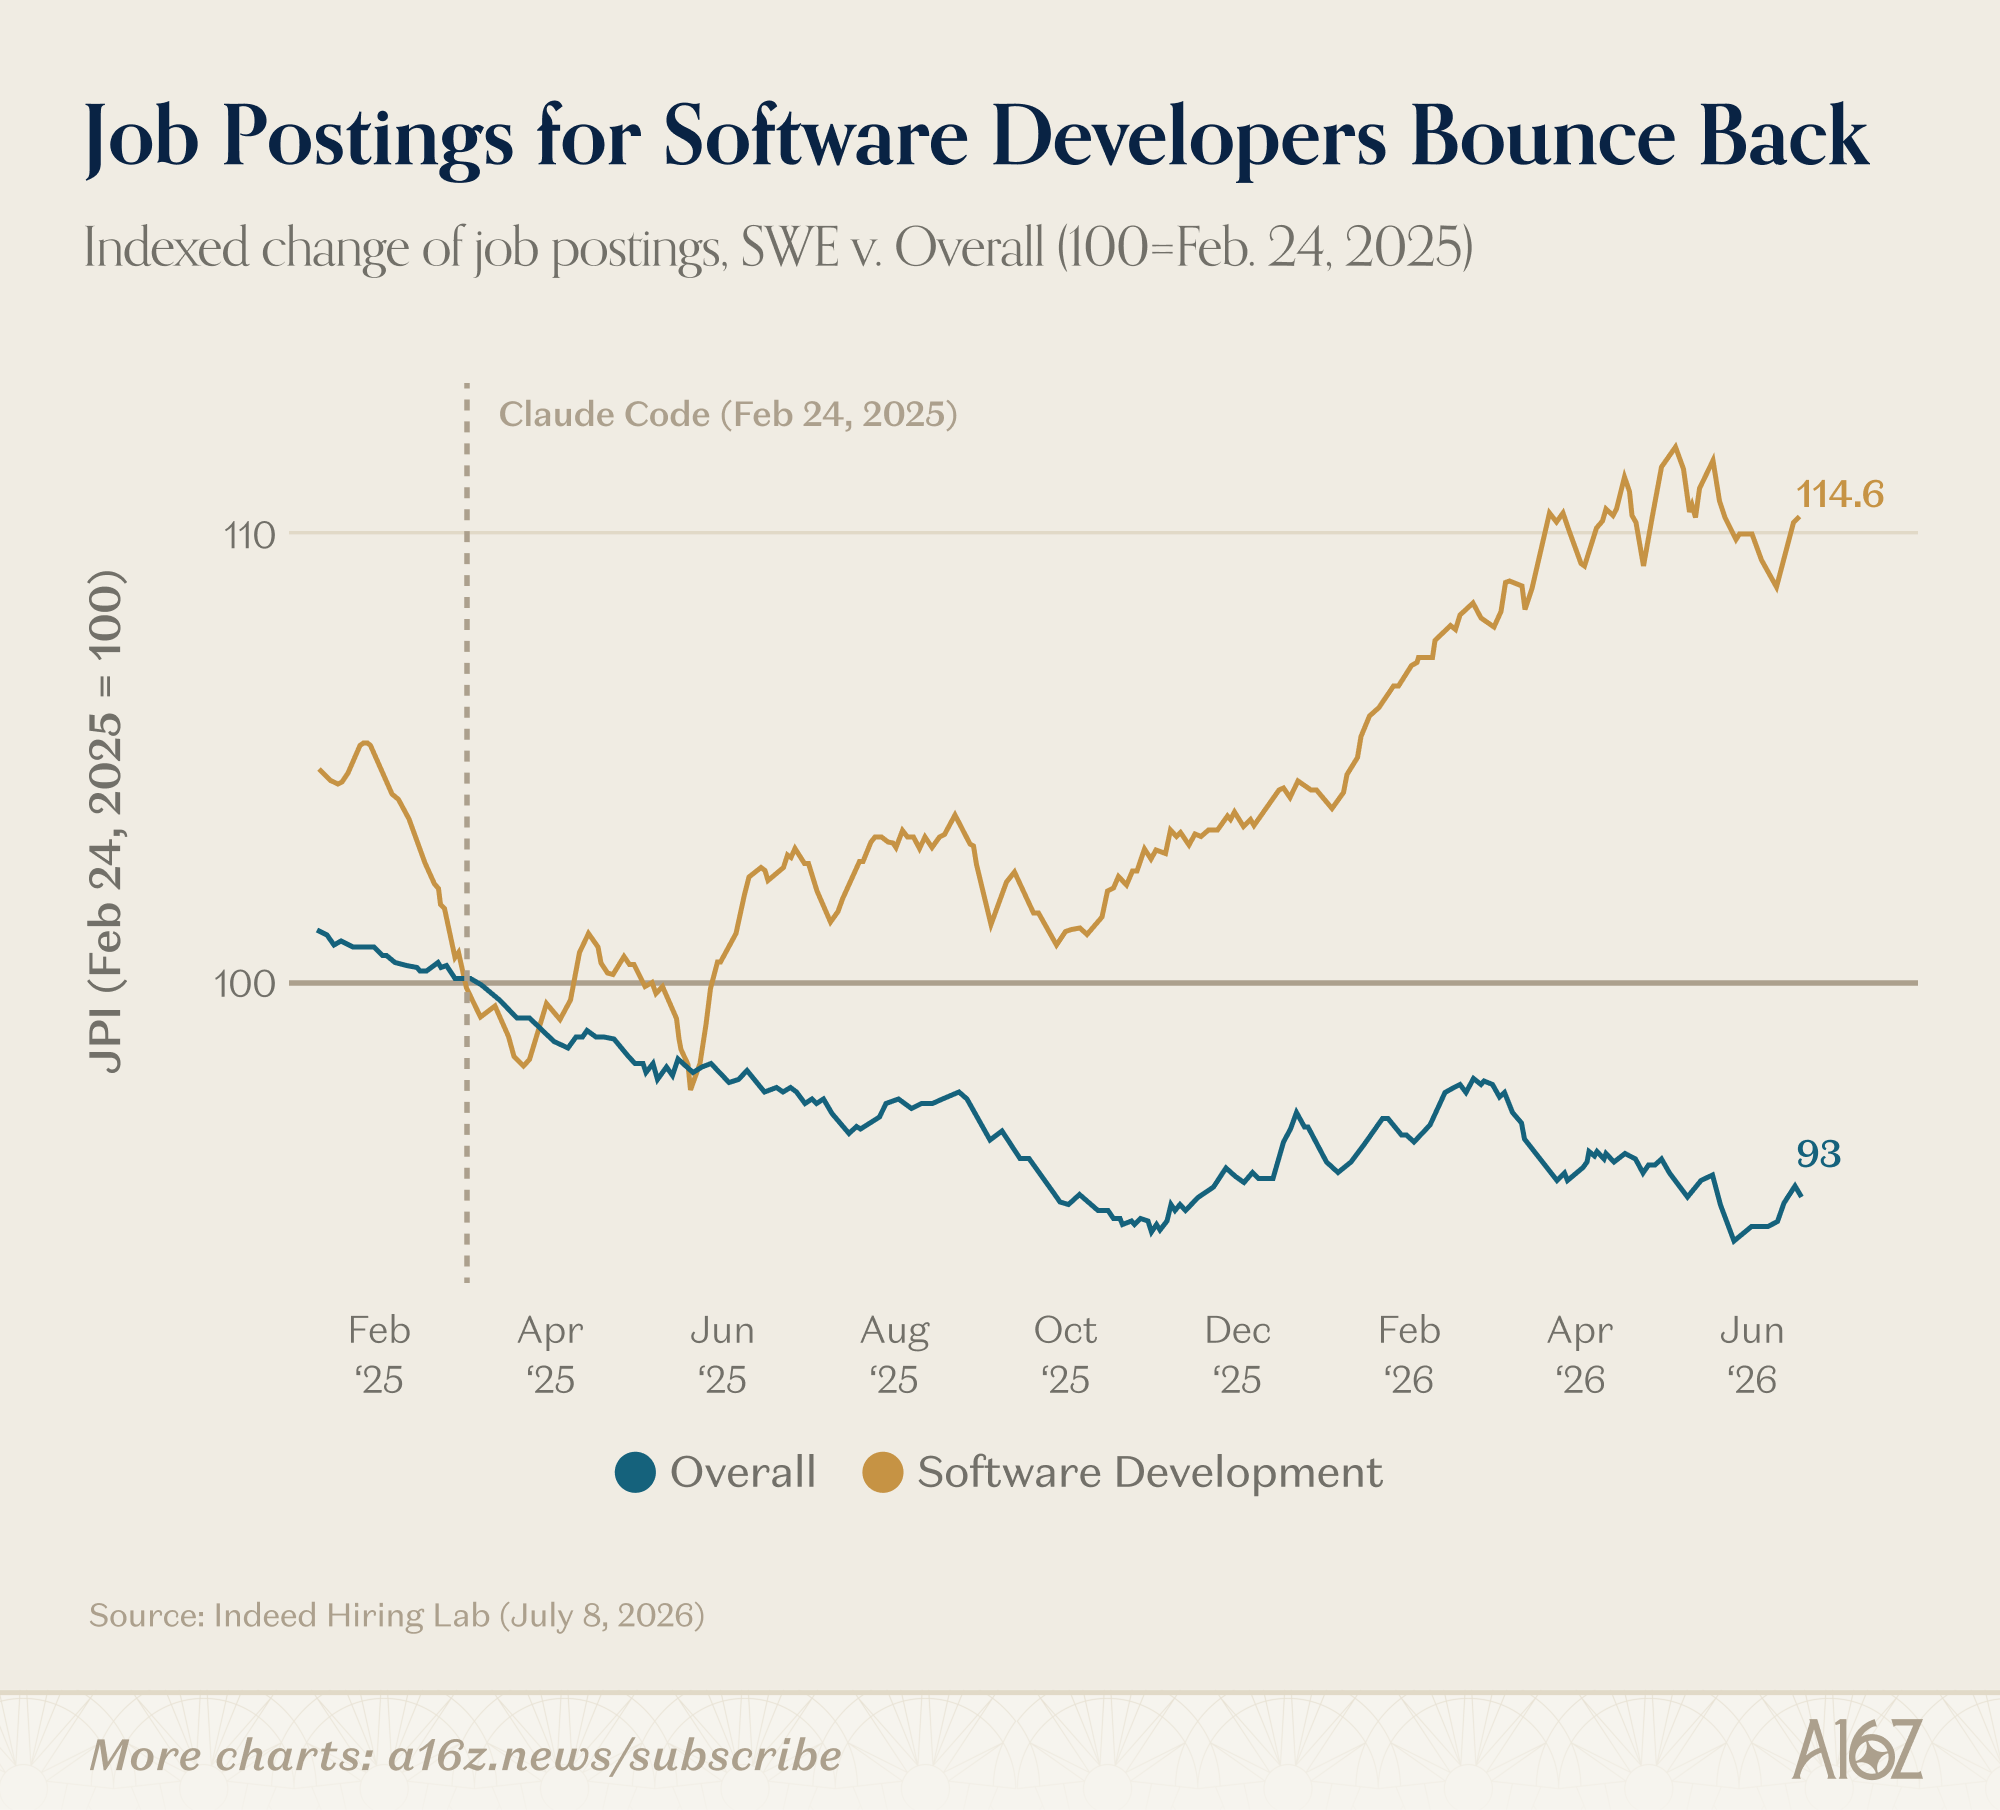
The structure of the hiring recovery points the same direction. Since May 2025, the higher a role's AI exposure, the stronger its hiring recovery has been. Software engineers stand out in particular: since Claude Code launched, related job postings are up roughly 15%, while overall postings are down roughly 7%.
One caveat worth flagging: the concept of "AI exposure" itself is contested. The higher a role's average AI exposure, the more disagreement there is about exactly how exposed it is. A few roles do get broad agreement — proofreaders, insurance underwriters, statisticians, and economists are all considered highly exposed to AI. Smart people disagreeing about a new technology's future impact isn't exactly surprising.
Zoomed out, it's still too early to draw firm conclusions. But if anyone wants to declare that "AI is making humans obsolete," the current data doesn't back them up.
Are data centers really driving up your power bill?
Earlier this week, New York Governor Hochul announced a one-year pause on data center construction. One stated reason: data centers might drive up power bills, and the move is meant to "protect ratepayers."
It sounds intuitive — more demand should mean higher prices. But the data paints the opposite picture: if anything, data centers appear to be helping keep residential power prices down.
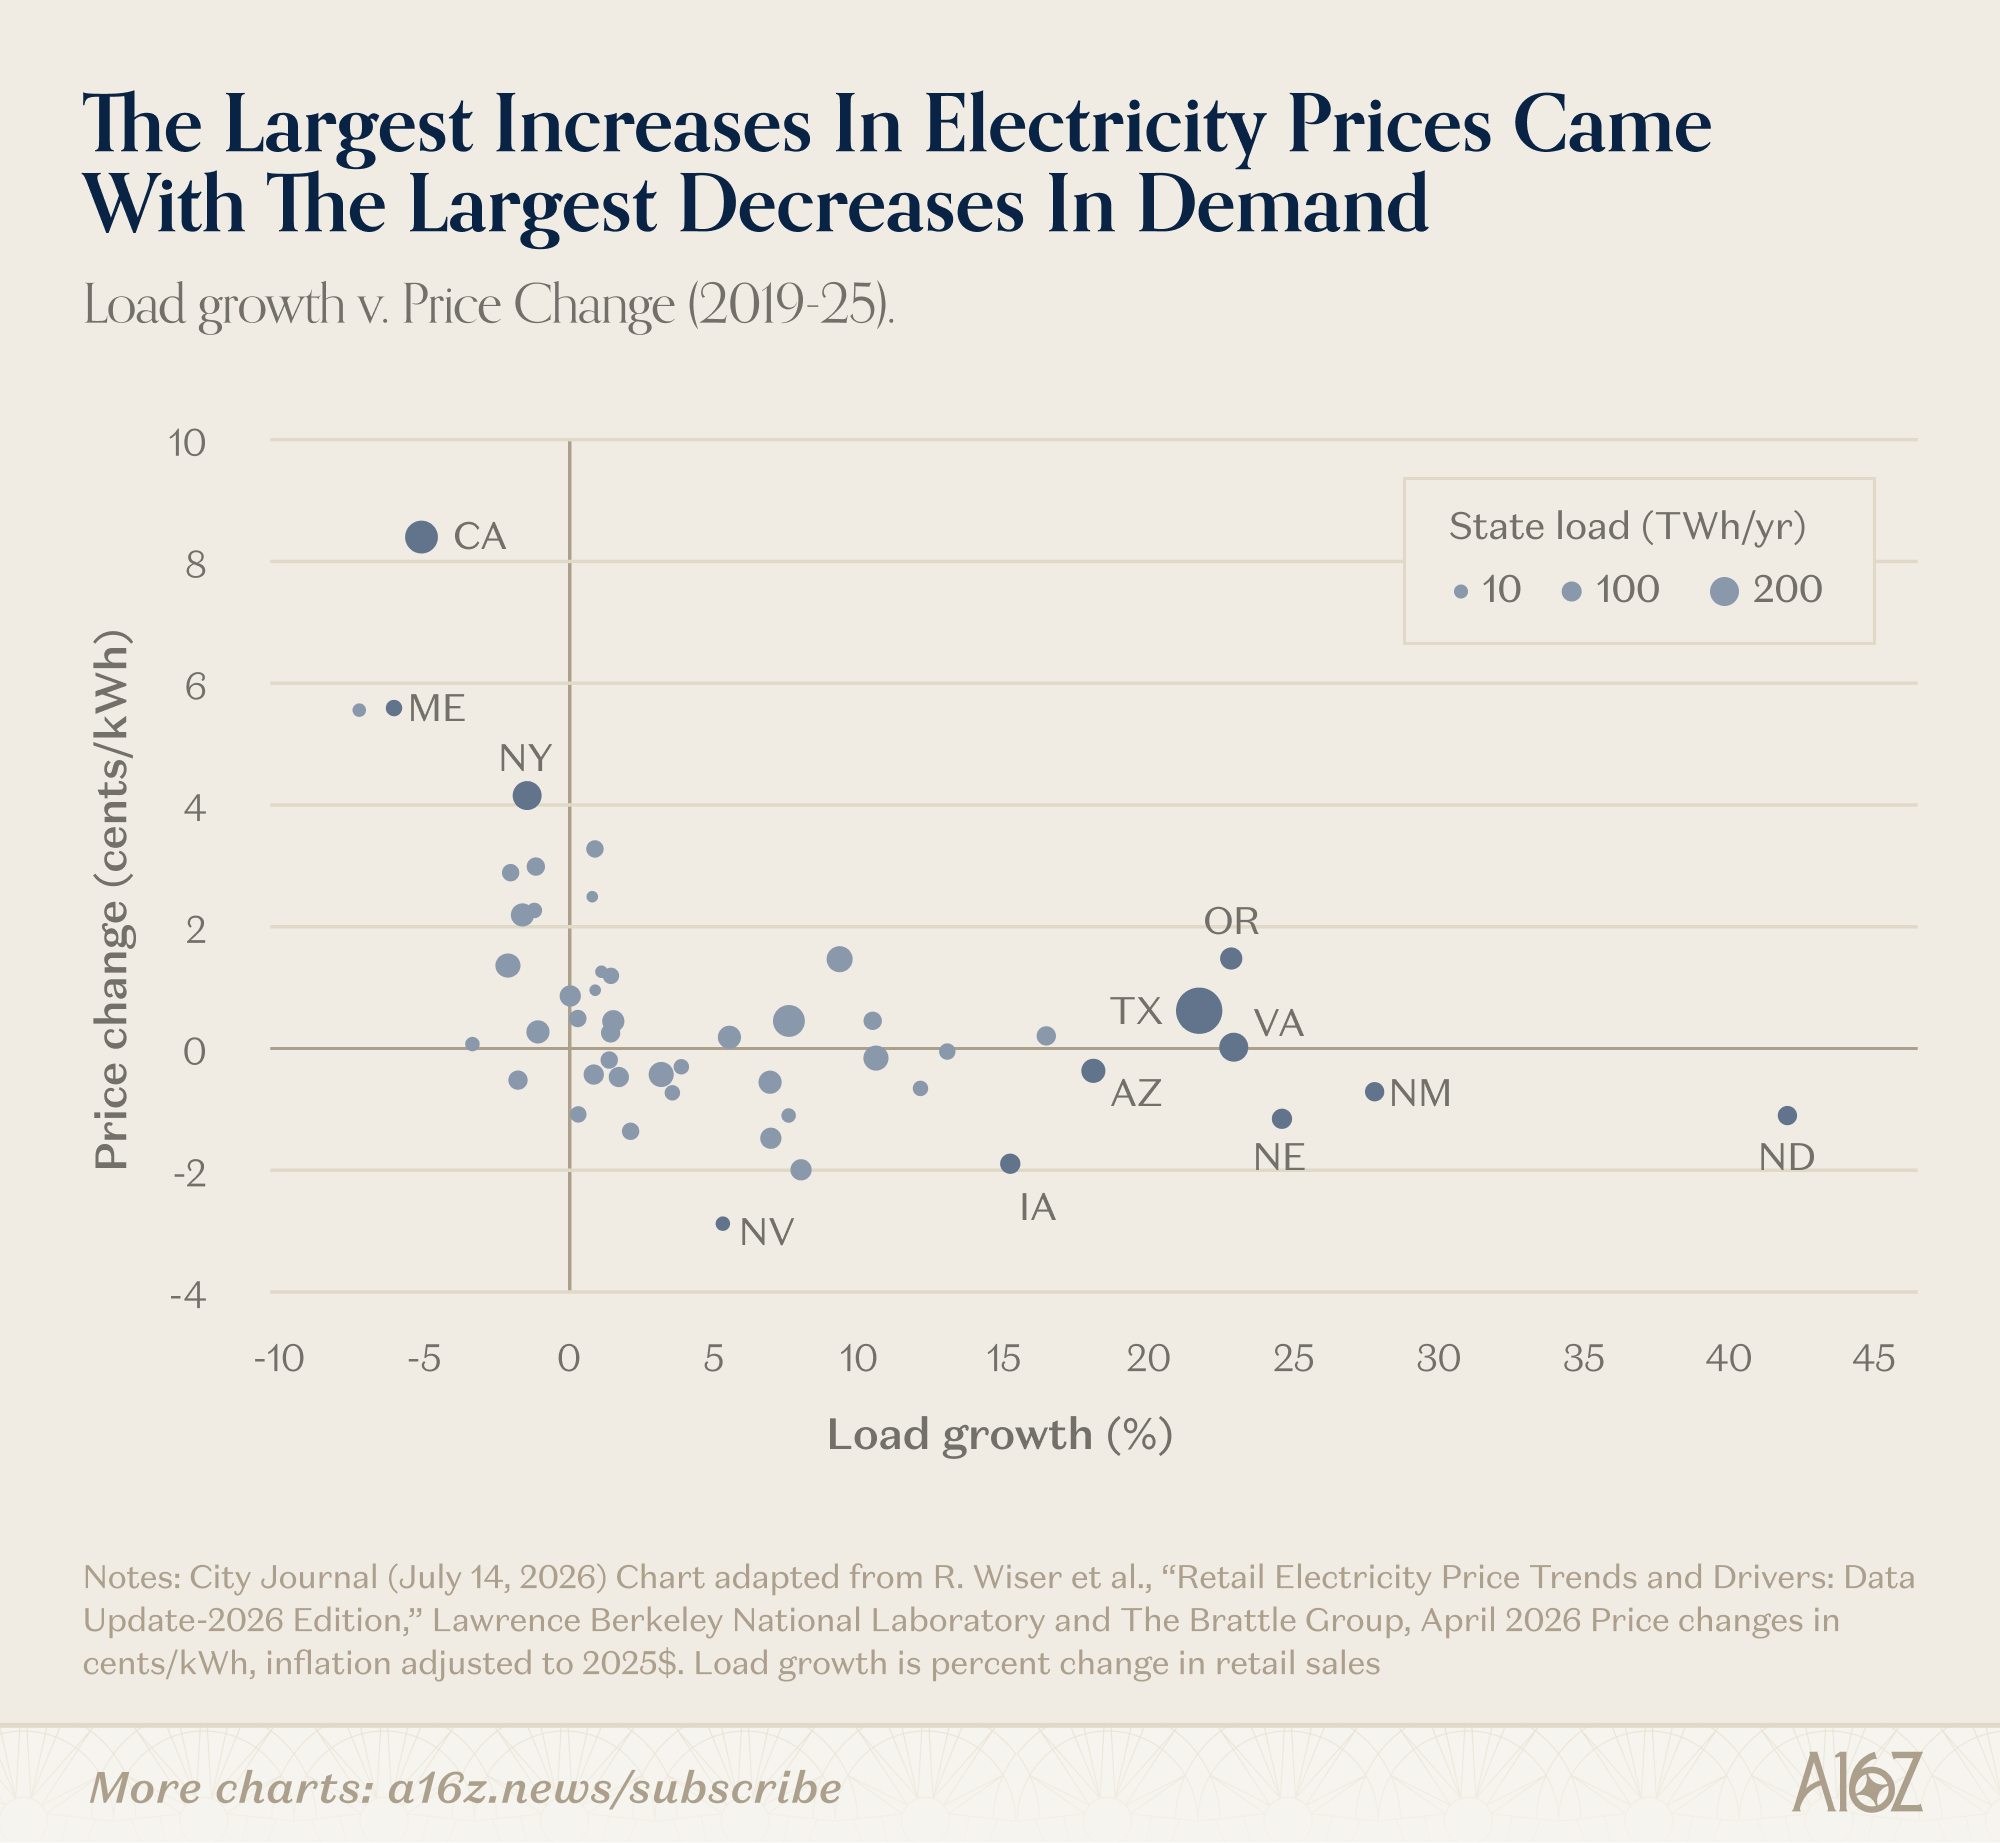
Over the past six years, the states with the fastest-growing electricity demand and the most new data centers — Texas and Virginia, for instance — have seen almost no price increases. Meanwhile, California and New York, which lead in price increases, are exactly the places with few new data centers and falling electricity demand. California's demand fell by about 5%, yet it saw the largest per-kilowatt-hour price increase in the country — about 33% higher than the state with the second-largest increase. Use more, pay less: it's counterintuitive, but that's what's happening.
Why does it flip? The key is economies of scale in the grid.
Those fixed infrastructure costs are essentially locked in. The more total electricity used, the more kilowatt-hours that fixed cost gets spread across — so the cost allocated to each kilowatt-hour drops, and residential prices trend down with it. Data centers growing total demand help shoulder that fixed cost alongside everyone else.
Widen the lens to Europe and the pattern holds globally too. Setting Ireland aside, the EU countries with the biggest price increases are also the ones with the biggest demand declines.
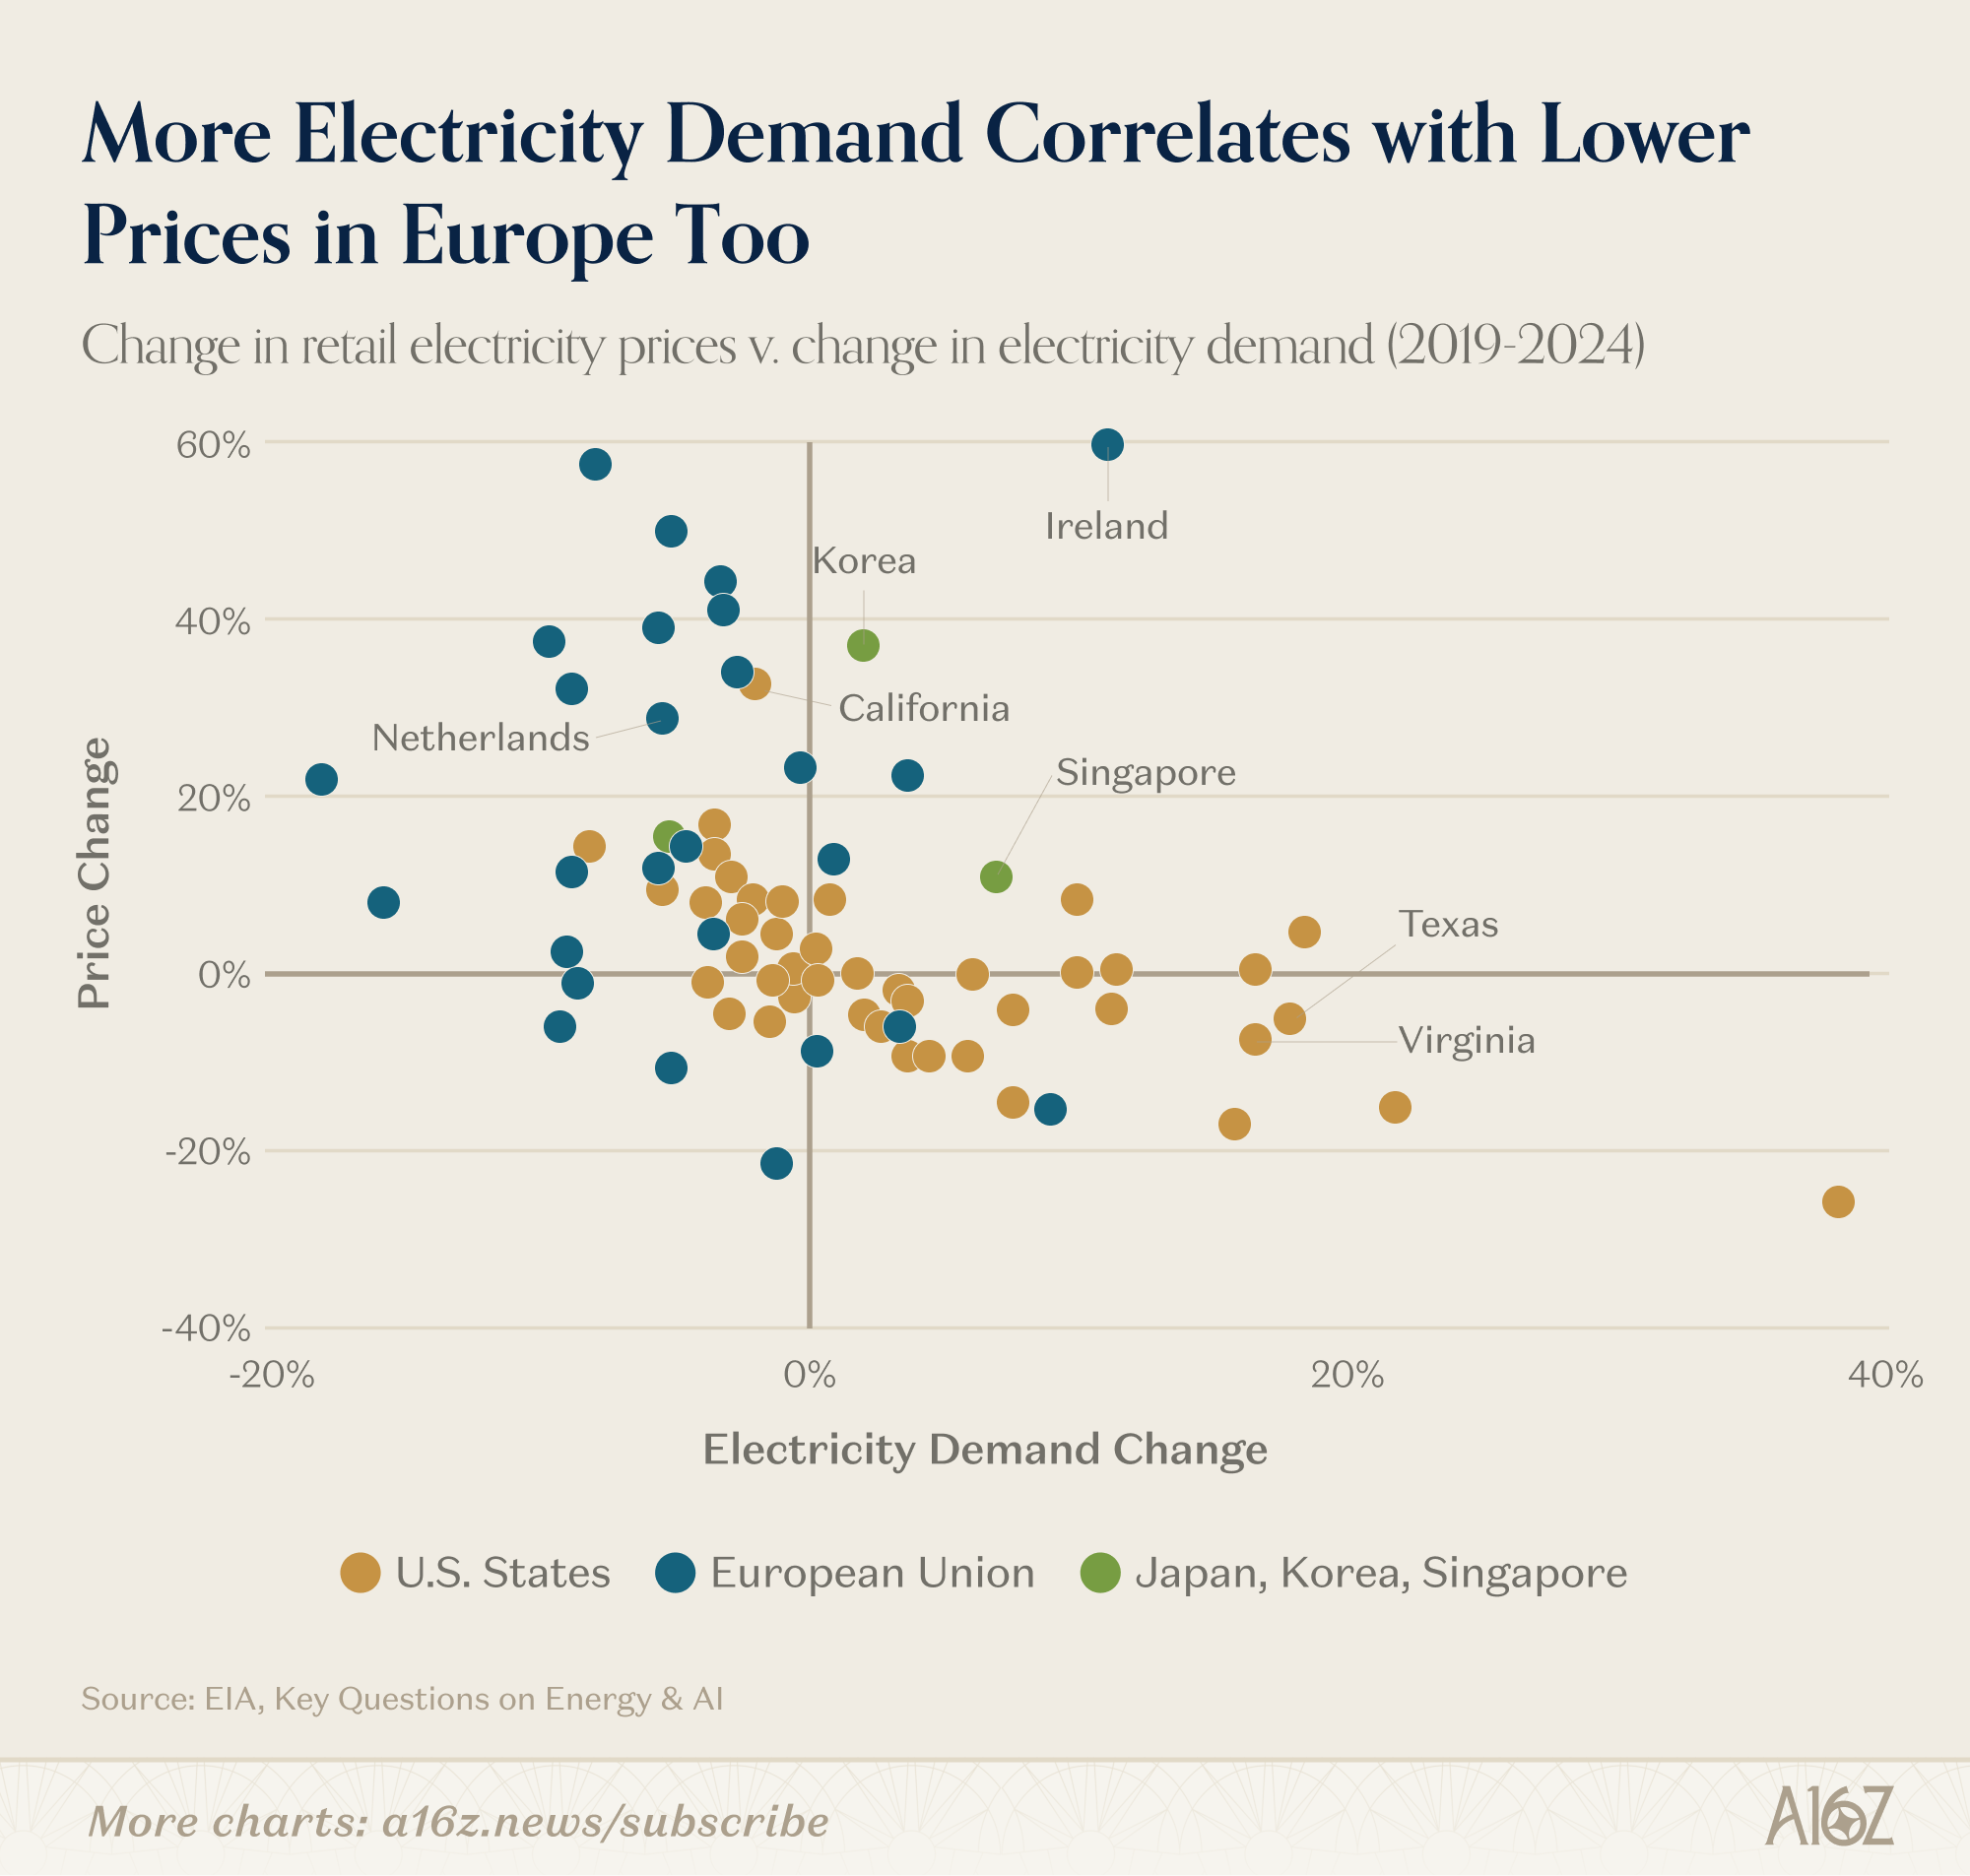
Following that logic, Hochul's pause could backfire: without data centers helping share the grid's fixed costs, prices could climb even more than they would have with them. This relationship might not hold forever, but it's held so far.
There's a bigger number behind the electricity story too. Strip out AI-related infrastructure investment, and the US barely has any investment growth left at all.
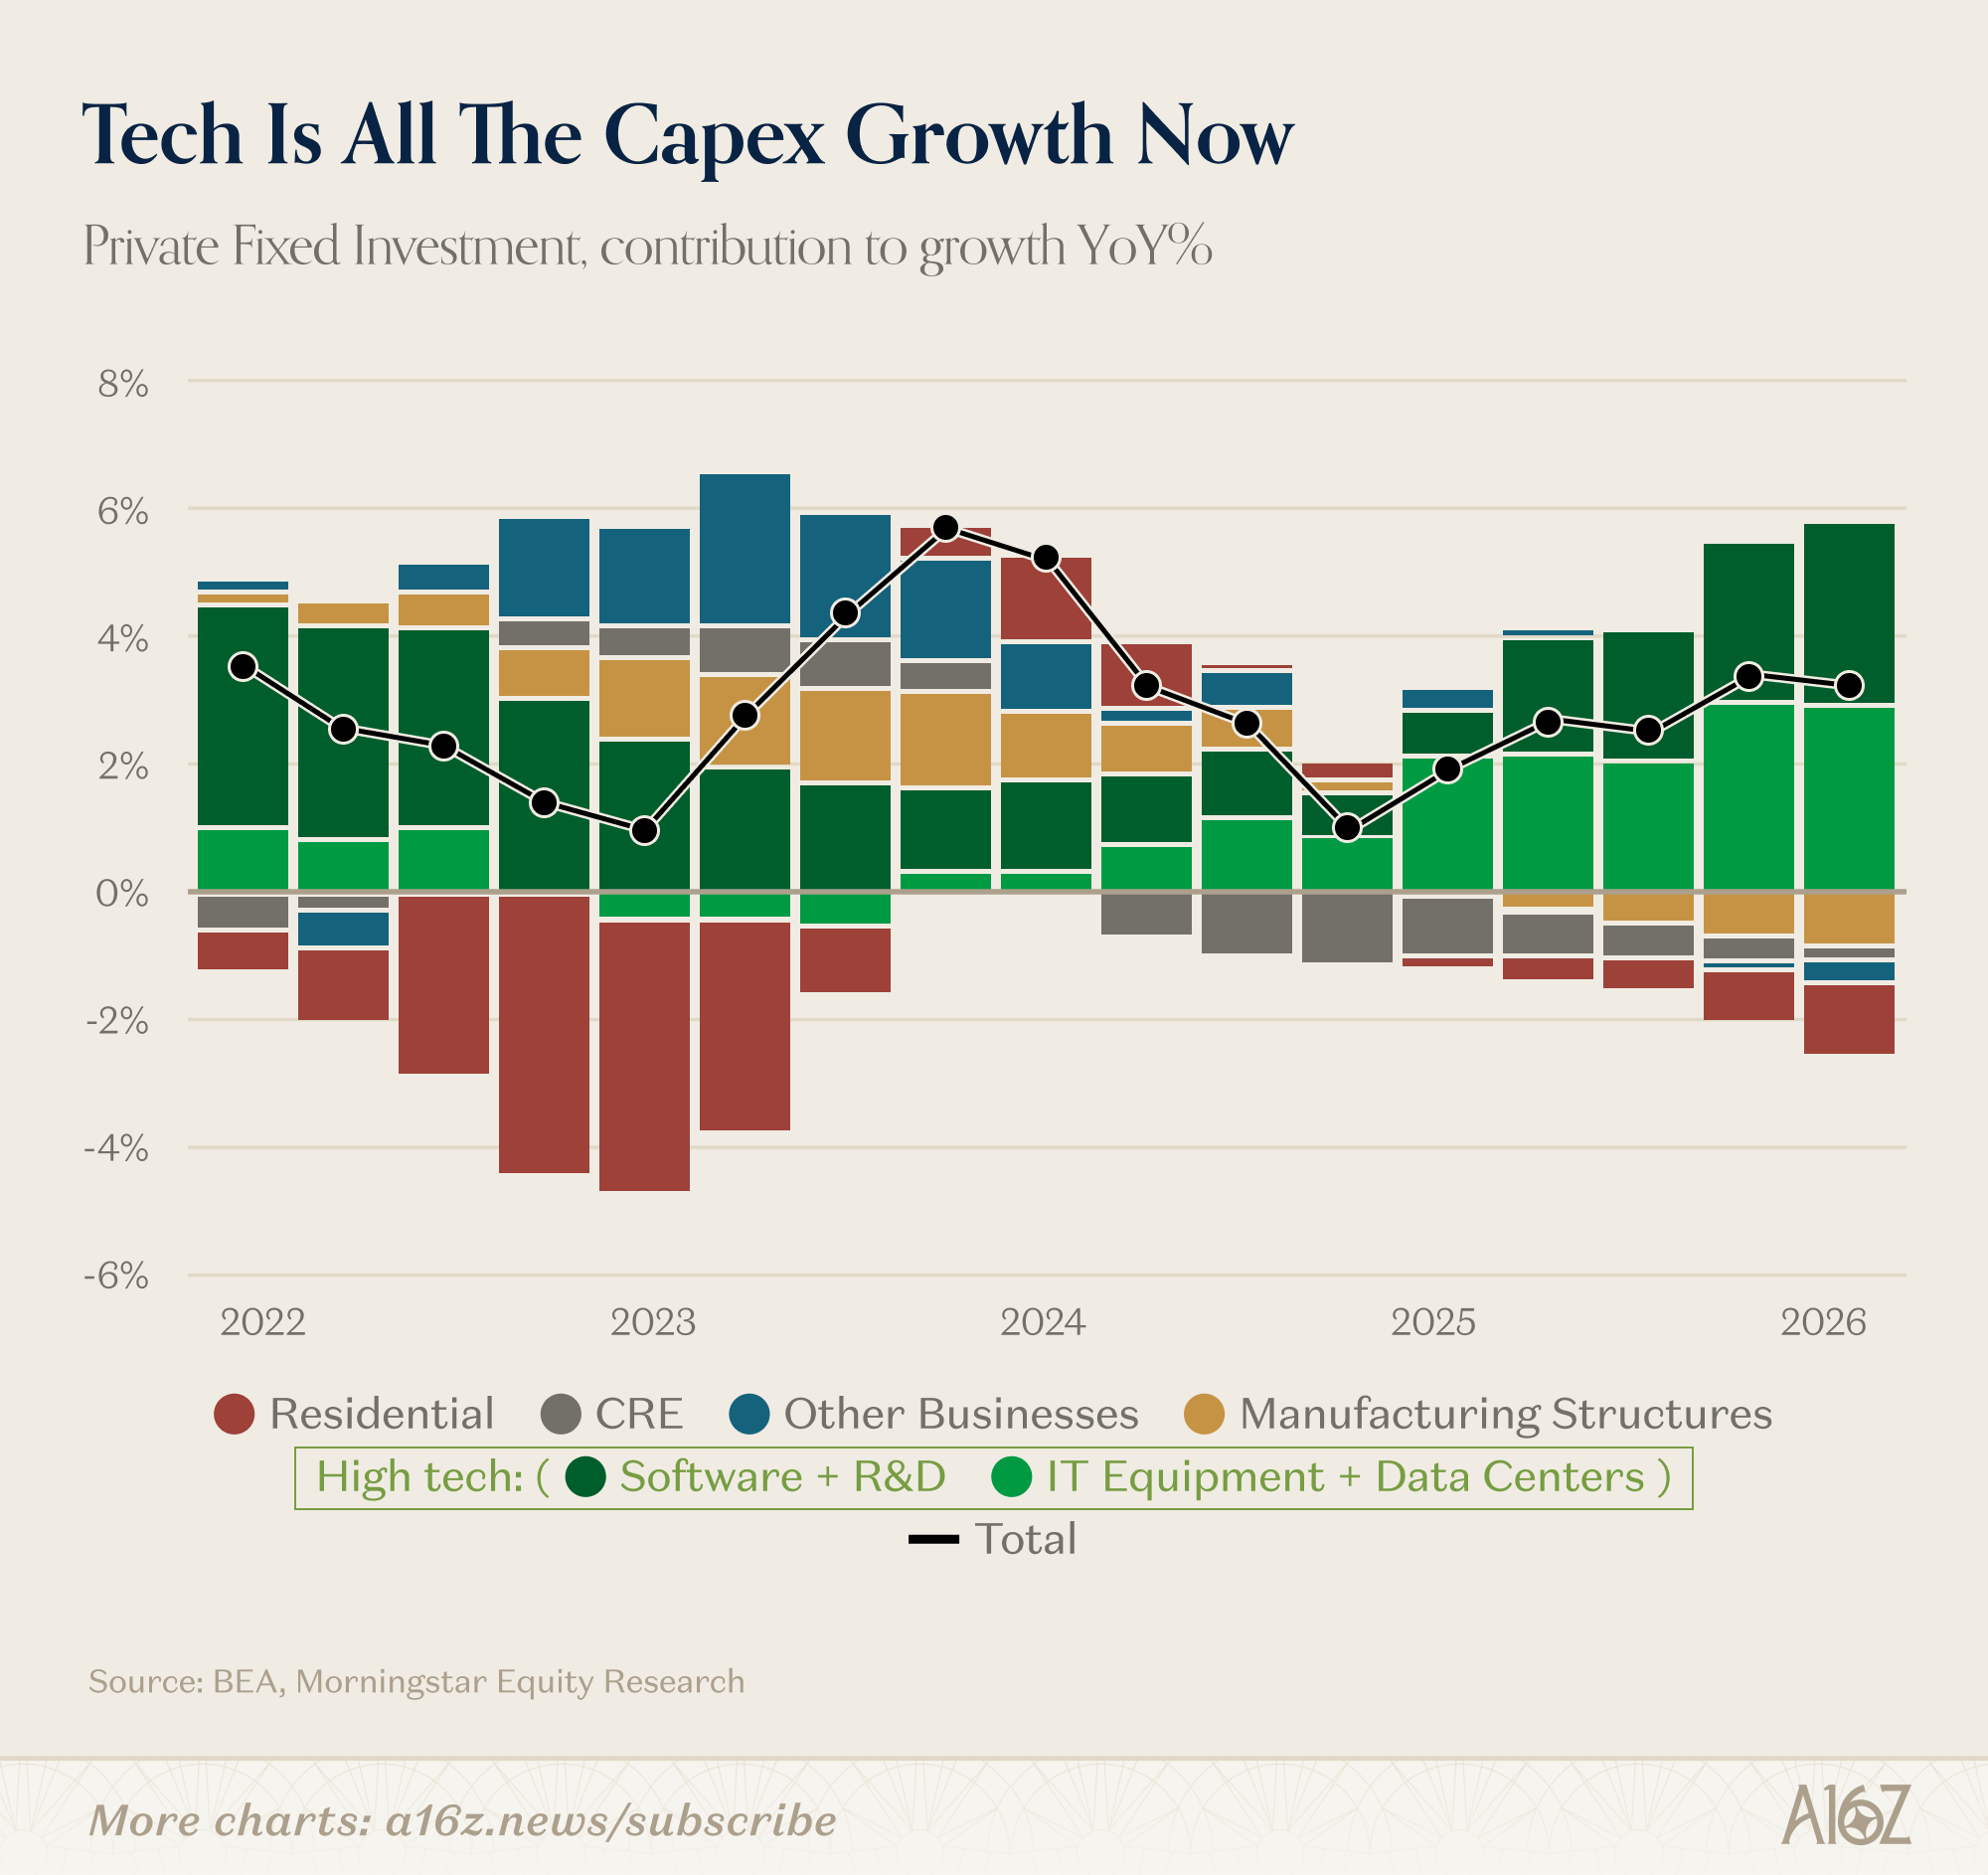
Tech-related investment is the only investment category still growing right now. A pause targeting data centers cuts right into that. A policy that might drive up power prices with one hand (in the name of "protecting ratepayers") while blocking the state's most important investment engine with the other — that math doesn't add up cleanly.
The market's yardstick for pricing software companies shifted from "how fast is it growing" to "will it hold up once AI arrives"
a16z ran nearly 20 data charts against four popular fears — software stocks, cheap models, AI job losses, power prices — in one illustrated page.
↓ Read the full page here · one chart animates
a16z is a US venture capital firm, and "Charts of the Week" is its weekly column picking a batch of data charts to comment on. The latest issue tackles four of today's most popular fears: software companies are about to get wiped out by AI, cheap models will undercut cash-burning frontier labs, AI is stealing people's jobs, and data centers are driving up your power bill.
Before reading charts like this, it helps to know what's there and what isn't.
✘ But which charts get picked, and what story they're used to tell, is a16z's own choice.
a16z is heavily invested in AI, so this set of charts leans bullish overall. The numbers themselves check out — just weigh the conclusions with that stance in mind.
Software companies really are getting sold. Their valuation multiple — how much the market pays for each dollar of cash they earn per year — has fallen back to 2014 levels, the lowest in over a decade. But this sell-off is selective: over the past 30 trading days, both the top quartile and the median company beat the entire software sector. What dragged the average down was the bottom quartile, home to several of the sector's biggest names.
Even stranger: how fast a company's revenue grows barely correlates with its recent stock price. The market changed its yardstick.
Lots of subscription revenue, features, users everywhere = safe
(That staying power is what a moat means)
- Sitting up top: cybersecurity, observability (tools that monitor software system health), and software built for a single industry — these hold onto industry-specific workflows, proprietary data, and customer trust that AI newcomers can't easily route around.
- Falling behind: general-purpose software anyone can use, cloud infrastructure, ad tech, and more — none of that protection. The original source put it bluntly: software alone no longer counts as a moat.
What about the other three fears? The data mostly points the other way. Two of them, in fact, share the same counterintuitive mechanic: the more something gets used, the cheaper it gets.
Economics has an old rule called the Jevons effect: the cheaper something gets to use, the more total usage and total spend rise — not fall. A fuel-efficient car makes people drive farther, and total fuel consumption across society goes up, not down. Intelligence and electricity each follow one end of this same path.
Just how fast is intelligence getting cheaper? Use the computer as a reference point: the same magnitude of price decline took the PC over a decade; this round of AI has covered it in roughly 3 years.
On the jobs front, there's almost no evidence AI is destroying jobs: 2026 summer internships, wages for young workers, and entry-level hiring are all rebounding.
Who measured these numbers: the underlying data comes from third parties including Goldman Sachs, PNC Bank, YipitData and OpenRouter, Revelio and Ramp, Indeed Hiring Lab, and Berkeley Lab; the chart selection and framing are a16z's own. The jobs chart supports other readings too — companies adopting AI might already be growth-oriented, and the sample might not represent the whole economy. Both hold up. The one reading that doesn't hold up is "AI is destroying entry-level jobs."
- × Fast revenue growth
- × Piles of features
- × Users everywhere