OpenAI analyzed 800,000 work-related messages: most of what people use AI for is not what their job was supposed to be
- OpenAI's Economic Research team analyzed over 800,000 work-related ChatGPT messages to see how much AI work falls outside employee job descriptions.
- Out of every 100 work messages, roughly 17 involve doing tasks belonging to another role. The widely quoted "43.5%" figure appears only after discarding the 61.5% of generic work (like writing emails and scheduling meetings) and treating the remaining specialized prompts as 100%.
- Using this baseline, task crossover exceeds 50% in five of eight occupations: customer experience at 77%, design at 75%, HR at 69%, with engineering lowest at 28%.
- Design is the most extreme case: 35.2% of prompts bring in other roles' tasks, while design tasks account for just 1.7% of other roles' prompts—designers do everything, but nobody else does design.
- The report buries the key context in the Appendix on page 15: when generic work is included back into each role, 65%–82% of activity in all eight occupations still consists of own-occupation and shared work. Task crossover is an addition, not a replacement.
For every 100 work messages, 17 involve doing someone else's job
On July 27, 2026, OpenAI's Economic Research team published a 16-page report titled Work at the Frontier, analyzing more than 800,000 work-related ChatGPT messages. It sets out to answer a specific question: How much of the work people do with AI falls outside their official job descriptions?
The report categorizes every message into three buckets. Generic work—tasks like writing emails, scheduling meetings, or drafting text that apply across roles—makes up 61.5%. Own-occupation work—tasks matching your specific role—accounts for 21.8%. Crossover work—tasks historically belonging to another role—represents 16.8%. The sum equals 100.1% due to rounding.
The report terms this phenomenon task crossover: work historically associated with one occupation showing up in the AI conversations of workers in another. The study covers eight functional areas: customer experience (CX), design, engineering, finance, human resources (HR), legal, marketing, and sales.
This paper is the first installment in a broader series. It builds on OpenAI's earlier paper, The AI Jobs Transition Framework, which classified 921 US occupations covering ~148 million jobs into four buckets: 18% facing high automation exposure, 24% subject to "reconstruction," 12% likely to grow, and 46% largely unaffected in the short term. "Reconstruction" means the jobs remain, but the daily tasks shift. This new report examines what that reconstruction actually looks like on the ground.
The report is co-authored by Caroline Chin and Alex Martin Richmond. The background section cites "Autor, Chin, Salomons, and Seegmiller (2024)"—Chin herself. That paper, New Frontiers: The Origins and Content of New Work, 1940–2018, was published in the Quarterly Journal of Economics (QJE), Vol. 139, No. 3 (2024), led by MIT economist David Autor, exploring how new job titles emerged over the past eight decades. The lead author brings formal labor economics rigor to the analysis.
The next critical step is understanding how this 17% raw figure relates to the widely reported 43.5% statistic.
How the study classifies a message as task crossover
To determine whether a message represents crossover work, two things must be established: what the user's role is, and what task the message describes. The report follows a four-step pipeline, illustrated by an example from Figure 1 of the report:
Click the four tabs above to step through the workflow. Re-created from Figure 1 in the report.
Two key concepts provide essential context. O*NET is the US Department of Labor's occupational database, breaking down professions into detailed work activities. The study uses it as the baseline standard for task ownership. A detailed work activity (DWA) is the smallest unit of measurement on this scale—such as "troubleshoot computer applications or systems" or "calculate financial data."
O*NET functions like a master nationwide job description manual. Open it to "Sales," and every expected sales duty is listed. The report translates each ChatGPT message into an item in this manual, then checks whose job description page that item appears on.
Role boundaries include a built-in buffer zone. The report does not enforce strict exact matches: if a task shares a semantic similarity score above 0.80 (out of 1.0) with the closest task in a worker's own occupational boundary, it is still classified as own-occupation work. As a result, the "own-occupation" threshold is generous, making the bar for task crossover higher than a literal reading suggests.
Details of the classification pipeline
To qualify for classification, a message must meet three criteria: user role identifiable, user based in the US, and content work-related. Qualifying prompts are mapped first to an intermediate work activity (IWA), then to a specific DWA selected from that IWA or the five IWAs with the closest title vector embeddings. For occupational boundaries, functional roles were mapped to specific SOC codes weighted by employment shares, linking to DWAs via O*NET task items and ratings. This layered approach avoids direct end-to-end prompt-to-DWA tagging.
With the three categories defined, we reach the metric most distorted in media coverage.
The 43.5% figure comes from discarding 60% of messages
The 16.8% raw figure and the 43.5% headline figure are derived from the exact same pool of messages. The difference comes down to a single methodological step: dropping the 61.5% of generic work entirely from the denominator, leaving only the 38.5% of "specialized prompts," and re-basing that 38.5% to 100%. Calculating 16.8% over this reduced 38.5% denominator yields 43.5%.
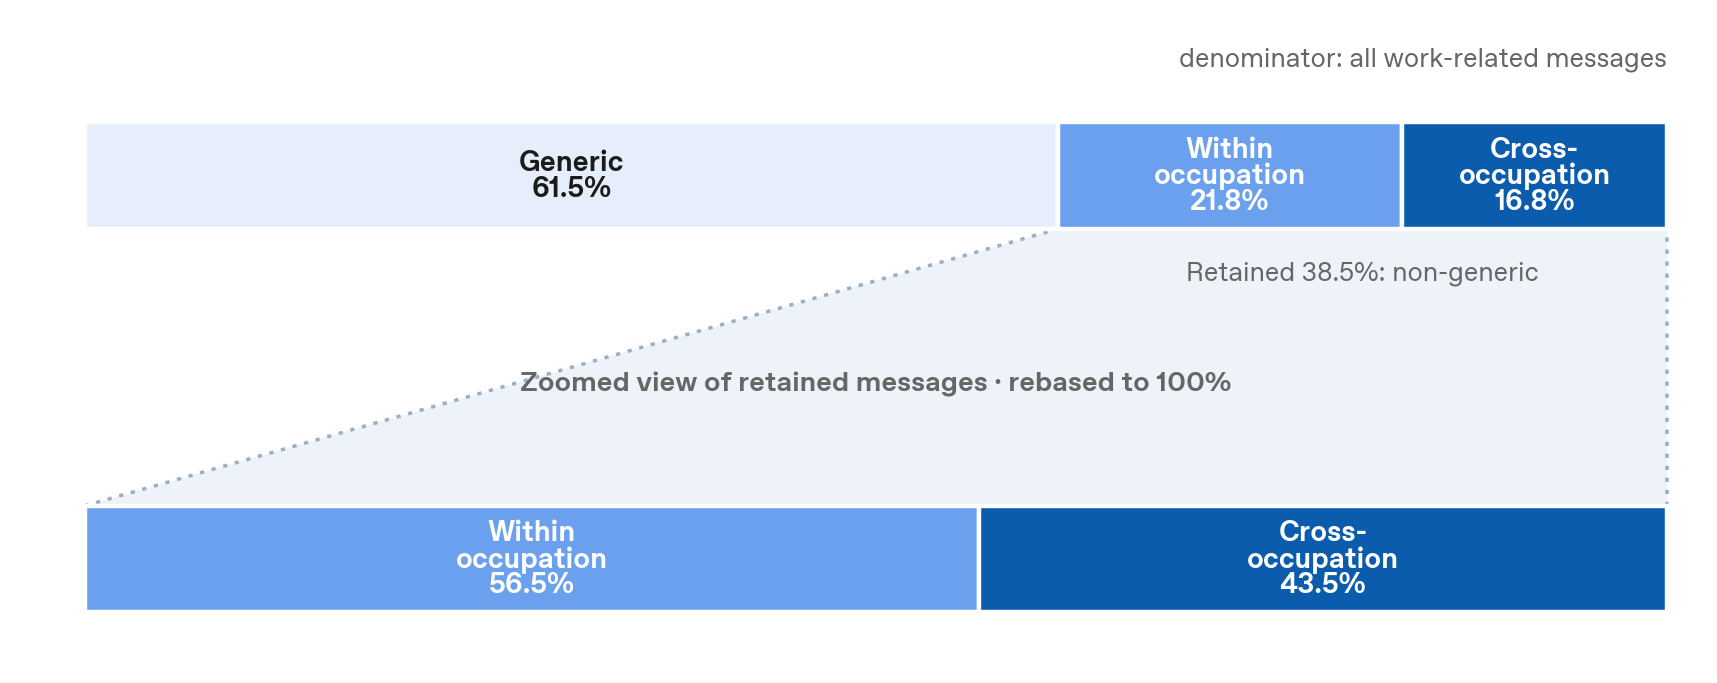
The report explicitly highlights this adjustment: the chart states "rebased to 100%," and the text specifies "excluding generic work." The nuance was lost primarily in secondary commentary.
Out of every 100 work messages, roughly 17 involve tasks belonging to someone else's job.
Looking strictly at prompts that map to a specific specialized domain, nearly half involve task crossover.
The second statement sounds far more dramatic, yet the 60% it sets aside is precisely what most people use AI for every day: writing emails, editing copy, and scheduling meetings.
With the baseline defined, we can examine how the eight covered occupations compare under the report's specialized prompt framework. Unless noted otherwise, crossover ratios below refer to non-generic specialized prompts.
Customer experience and design cross boundaries most; engineering least
Breaking down the 43.5% figure across the eight functional roles reveals wide divergence: customer experience leads at 77%, while engineering sits at 28%—a nearly threefold difference.
Five of the eight roles exceed 50%. For workers in those top five dark-colored roles, when they ask ChatGPT a specialized question, more than half the time it falls outside their own domain.
Engineering's 28% figure needs context: it does not mean engineers avoid crossover work. In absolute volume, engineers generate vast amounts of own-occupation AI prompts—coding, debugging, code reviews—which fall squarely within engineering boundaries, expanding the denominator and diluting the crossover share. As shown later, crossover messages account for 18.5% of engineers' total work prompts (including generic work), also the lowest among the eight roles. That, however, is entirely separate from whether engineering tasks travel to other roles.
Marketing and engineering tasks travel to every other role
While the previous section shows which roles perform crossover work, Figure 4 from the report reveals whose tasks they are borrowing: each row represents a worker occupation, each column represents the traditional O*NET home of the task, and bubble size reflects percentage share.
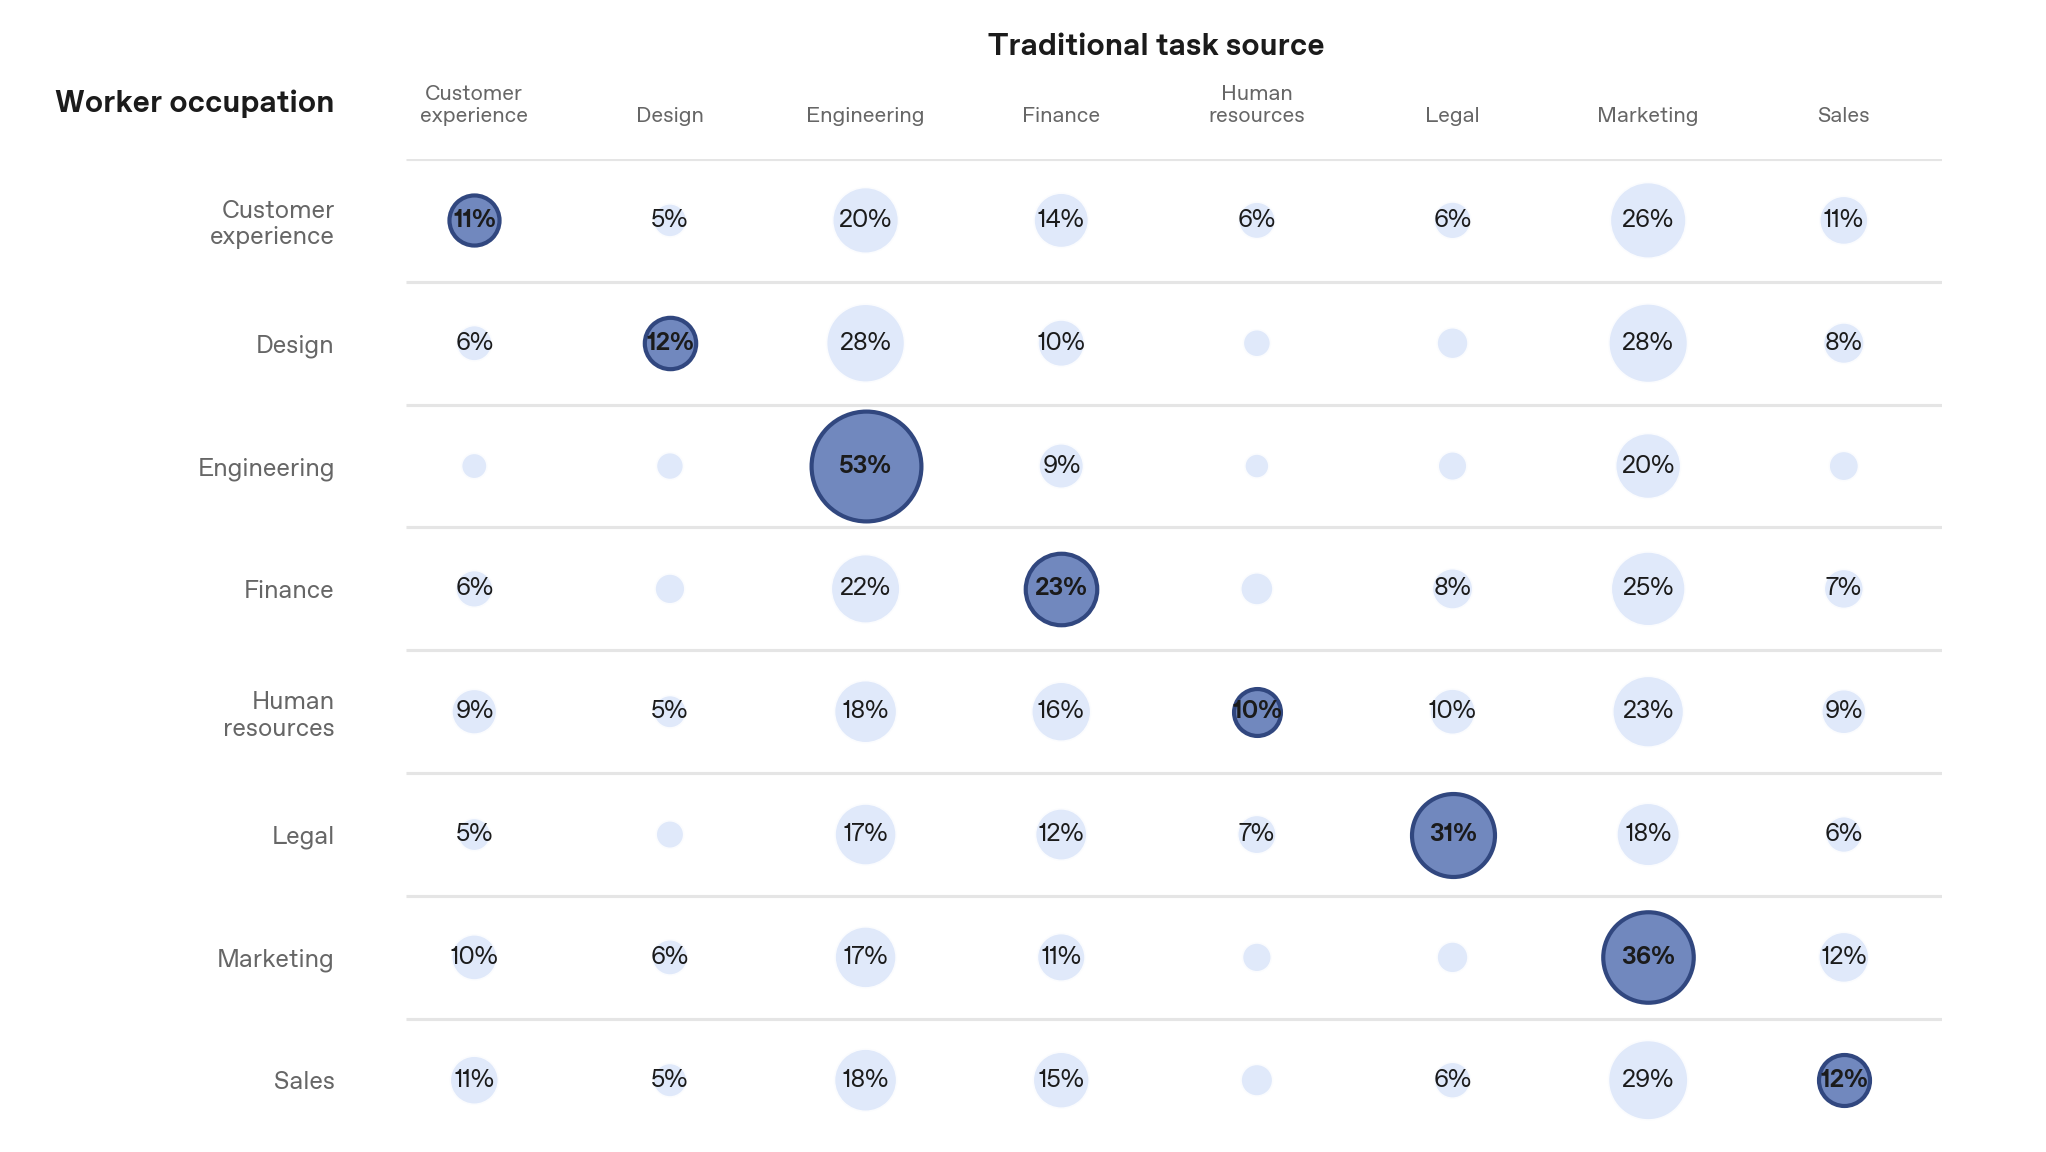
The report notes that marketing and engineering tasks appear most frequently across other roles' AI usage. Specifically, marketing tasks account for 28%–29% of non-generic prompts from sales and design workers, and 26% from customer experience workers. Engineering tasks make up 28% of design workers' non-generic prompts, and 20%–22% for customer experience and finance workers.
Examining this matrix row by row reveals a key pattern not explicitly highlighted in the text:
For five of the eight occupations, the largest task category in their prompts is not their own occupation. In all five cases, the top task category is Marketing (with Design tying between Marketing and Engineering).
Comparing rows reveals clear patterns summarized below:
| Worker Occupation | Own Occupation Cell | Top Task Category in Row |
|---|---|---|
| Customer Experience | 11% | Marketing 26% (Engineering 20%) |
| Design | 12% | Engineering 28%, Marketing 28% |
| Human Resources | 10% | Marketing 23% (Engineering 18%) |
| Sales | 12% | Marketing 29% (Engineering 18%) |
| Finance | 23% | Marketing 25% |
| Engineering | 53% | Engineering (Own) |
| Marketing | 36% | Marketing (Own) |
| Legal | 31% | Legal (Own) |
Compiled from Figure 4 of the report. Labeled percentages per row sum to 82%–100% due to rounding and unlabeled minor bubbles. For finance, the 25% vs 23% gap is within margin of error.
Examining specific recurring tasks from Table 2 in the report highlights which activities travel most frequently across roles ("reach" indicates how many of the other seven occupations rank the task in their top three crossover items):
| Task | Traditional Home | Cross-Role Reach | Top Borrowing Role |
|---|---|---|---|
| Calculate financial data | Finance | 7/7 | Sales 14.3% |
| Troubleshoot computer applications or systems | Engineering | 7/7 | Customer Experience 7.6% |
| Communicate with customers about product or service information | Customer Experience | 7/7 | Marketing 70.8% |
| Draft marketing collateral | Marketing | 5/7 | Design 13.6% |
| Communicate with government agencies | Legal | 7/7 | Customer Experience 21.4% |
Financial data calculation and software troubleshooting show the broadest cross-role penetration, ranking in the top three across all seven other occupations. Among non-finance workers sending finance prompts, 9.8% focus on calculating financial data; among non-engineers sending engineering prompts, 6.1% involve software troubleshooting.
Among non-marketing workers generating marketing prompts, 25% focus on "developing promotional material"—ads, social posts, flyers, promo videos, decks, and product sheets—with 9.3% focused on "drafting marketing collateral" and 6.5% on "developing marketing strategies."
This raises a complementary question: which roles import tasks, and which roles export them?
Designers do everything, but nobody else does design
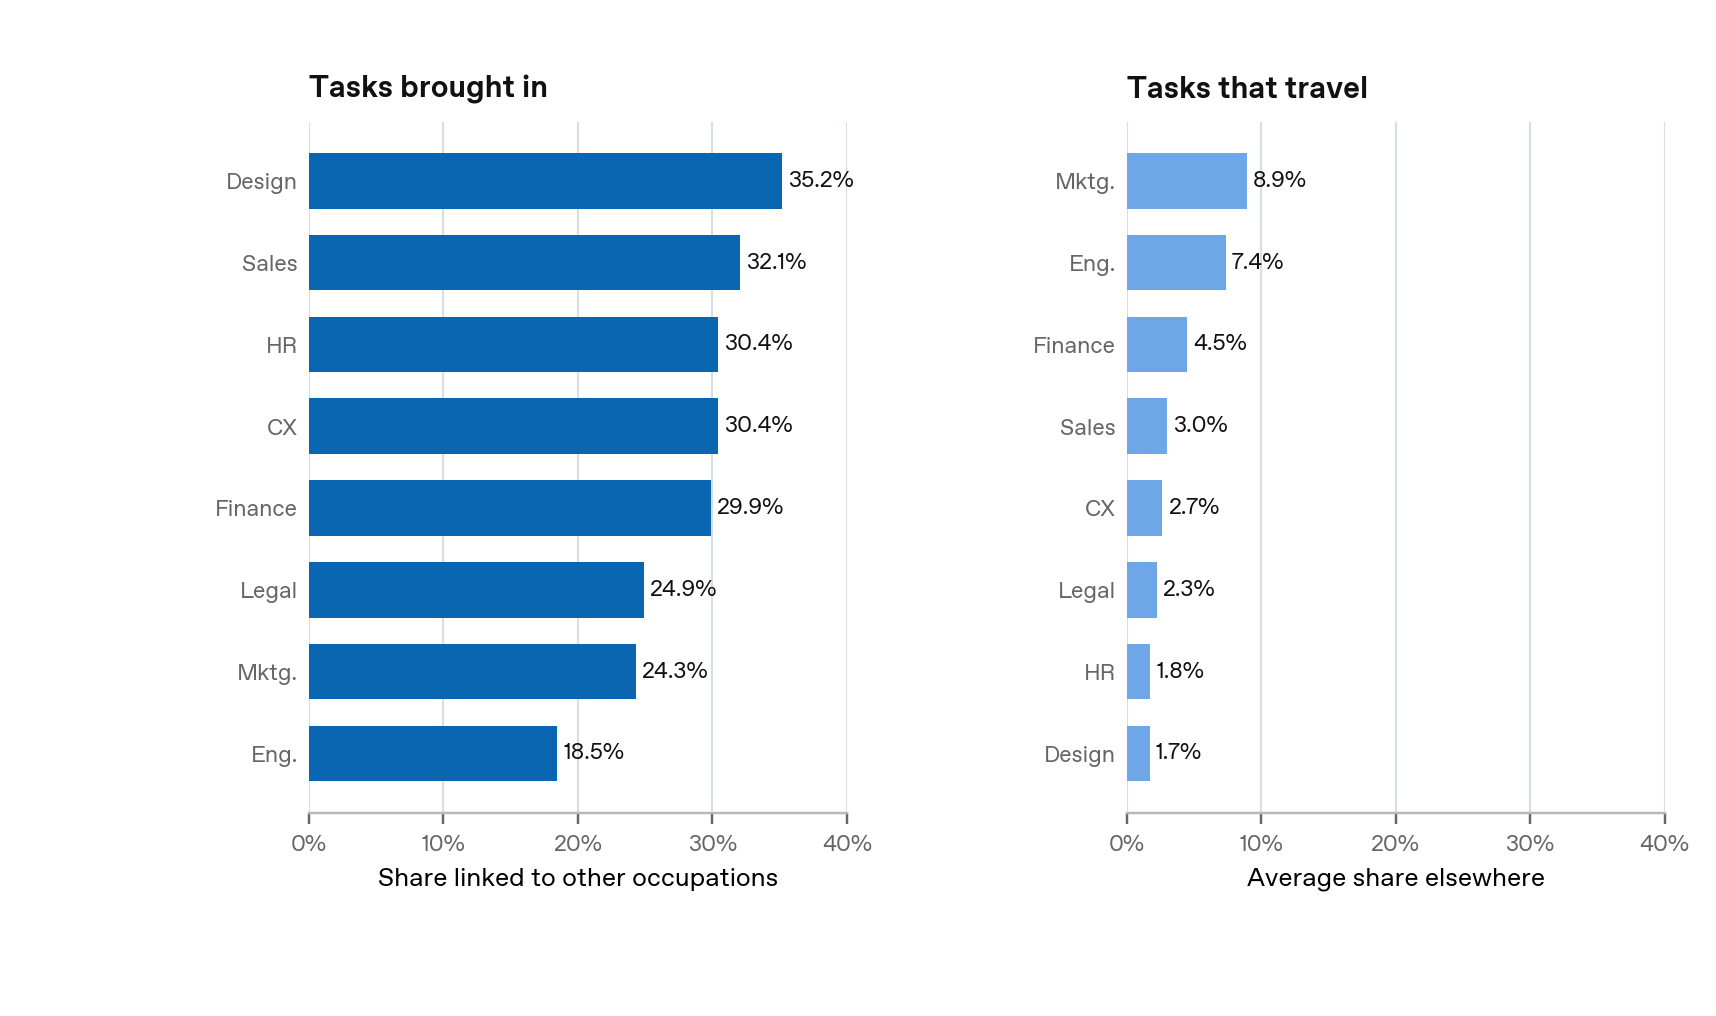
Figure 5 in the report separates task crossover into two directions: Tasks brought in measures how much external work a role incorporates into its AI prompts; Tasks that travel measures how often a role's traditional tasks appear in other workers' prompts.
Design occupies two opposite extremes: highest in tasks brought in (35.2%) and lowest in tasks that travel (1.7%)—a twentyfold imbalance. Designers leverage AI to absorb tasks from multiple functions, while non-designers rarely attempt design tasks via AI.
Engineering presents the reverse pattern: engineers import the fewest external tasks (18.5%), but engineering tasks travel second farthest (7.4%), making them among the most frequently borrowed by other functions.
Marketing leads on both fronts: 24.3% of marketing workers' prompts involve external tasks, while marketing tasks travel to other roles at a sample-wide high of 8.9%.
Integrators (Design): Use AI to combine tasks from multiple functions into their workflow.
Domain Anchors (Engineering): Focus internally while exporting expertise to others.
Hubs (Marketing): High volume in both directions.
The report includes an explicit caveat: task crossover does not signal the disappearance of these roles. While AI lowers entry barriers for non-experts tackling basic tasks, domain experts remain essential for specialized judgment and oversight. The findings reflect evolving task allocation rather than direct forecasts of headcount changes.
Beyond individual roles, how does organization size affect task crossover?
Smaller workplaces show more crossover, but only among moderate users
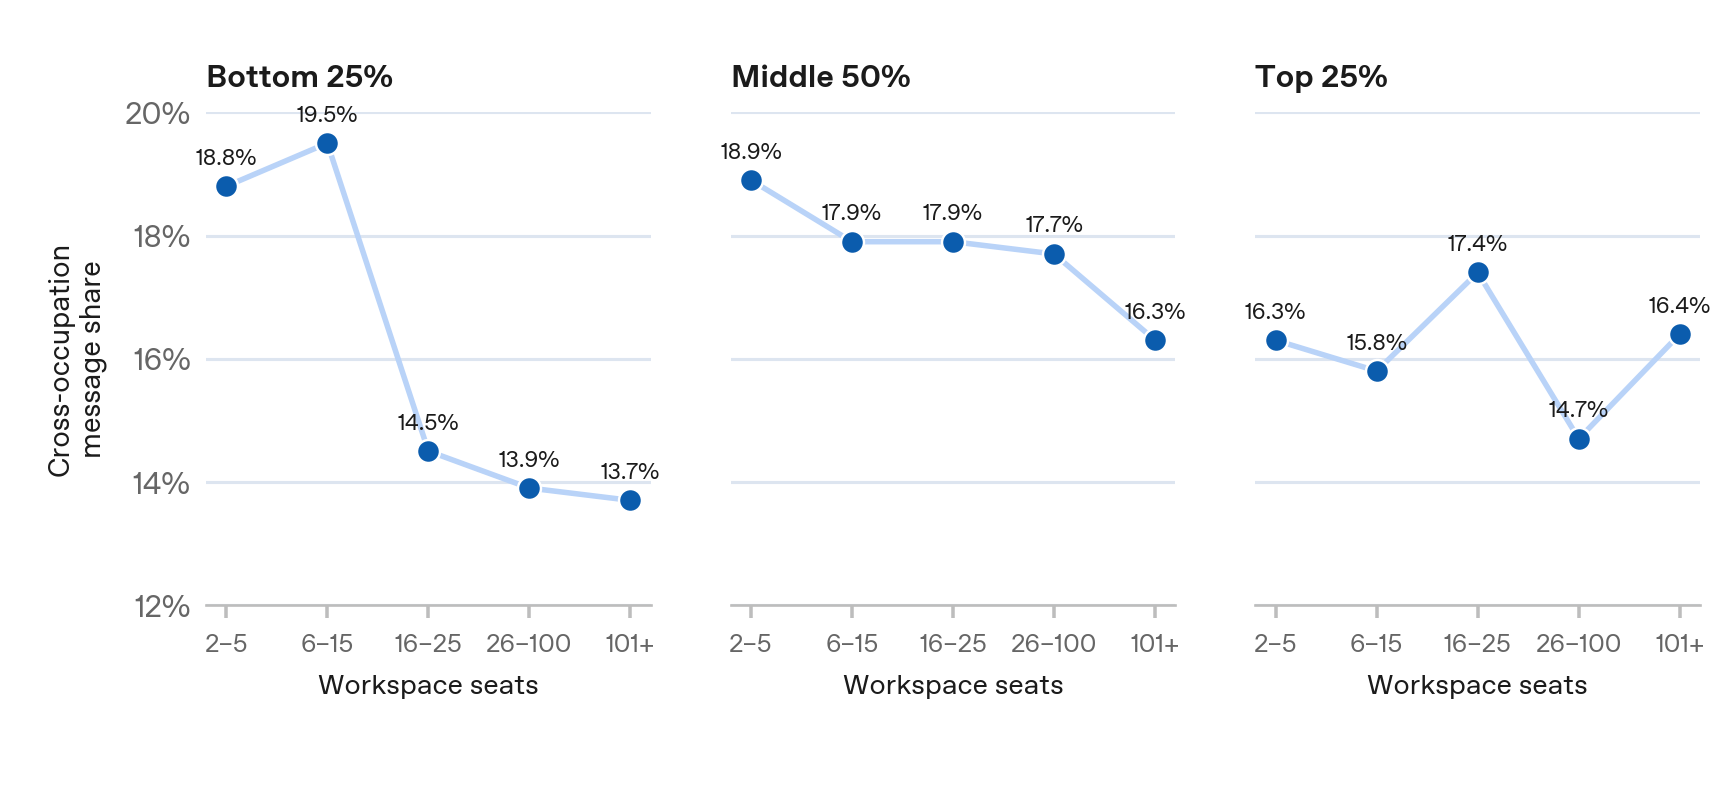
Figure 6 groups workspaces by seat count: workspaces with 2–5 seats average 18.9% crossover prompts, compared to 16.3% for those with over 100 seats—appearing to show a neat downward trend.
However, three caveats apply:
First, the slope is modest. The vertical axis in Figure 6 spans only 16% to 19%—a 3 percentage point range. The 2.6 point shift represents a ~13% relative decline from small to large workspaces.
Second, the trend holds only for mid-tier users. When breaking down users by prompt volume (Appendix Figure A1), the pattern diverges across tiers.
| Volume Tier | 2–5 Seats | 6–15 | 16–25 | 26–100 | 101+ |
|---|---|---|---|---|---|
| Bottom 25% | 18.8 | 19.5 | 14.5 | 13.9 | 13.7 |
| Middle 50% | 18.9 | 17.9 | 17.9 | 17.7 | 16.3 |
| Top 25% | 16.3 | 15.8 | 17.4 | 14.7 | 16.4 |
Values in percentages. Data from Appendix Figure A1. The report notes that for the bottom 25% tier, the 101+ seat bin contains only 197 messages.
The main text cites the middle tier. For high-volume users (top 25%), values fluctuate without a clear monotonic trend—a detail noted in the report.
Third, workspace seat count differs from enterprise headcount. Organizations may purchase seats for only a subset of staff. Seat counts serve as proxy indicators for specialization, industry type, organizational maturity, or peer availability.
One hypothesis offered is that small firms lack dedicated specialists, forcing employees to handle marketing copy, troubleshooting, or contract reviews independently with AI. In larger enterprises, workers are more likely to delegate such tasks to specialized internal teams. This represents a plausible interpretation rather than a proven causal relationship.
Crucially, all these proportions depend on excluding generic work. Restoring generic tasks alters the picture significantly.
Including generic work shows core domain retention across all roles
On page 15, the report re-calculates the matrix after assigning generic work back to each occupation's own category:
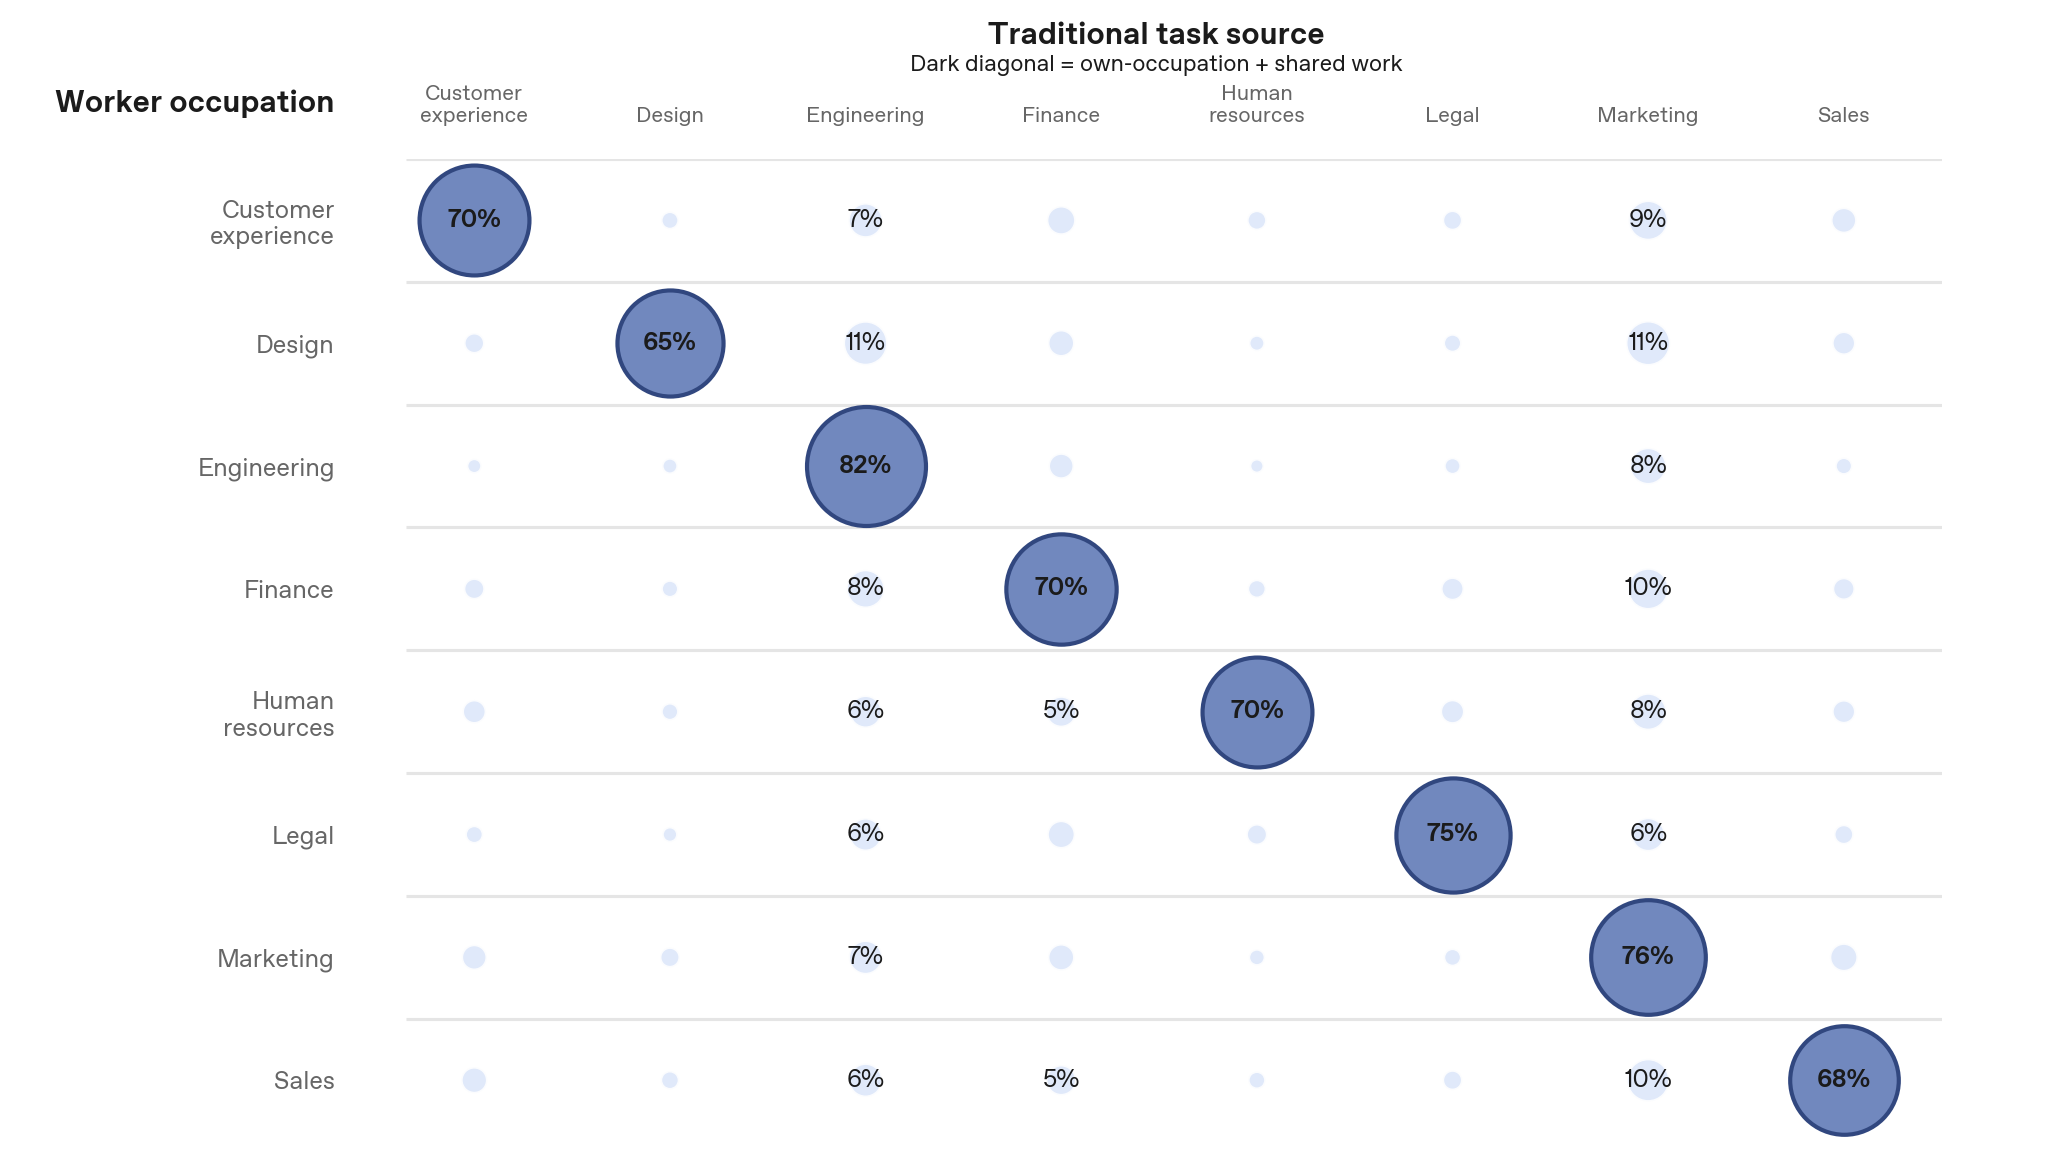
All eight occupations fall between 65% and 82%. Customer experience (77% crossover in specialized prompts) sits at 70% core retention here, while design (75% crossover) sits at 65%.
blockquote>Task crossover does not replace role-specific work: every occupation still retains a meaningful diagonal of same-occupation or shared activity.
Work at the Frontier, p. 15Simultaneously, non-diagonal matrix entries show workers regularly combining own-role duties with adjacent tasks—particularly in marketing and engineering. The report characterizes this as expanding job scope and blending task mixes, rather than wholesale role replacement.
The headline 43.5% figure emerges only after setting aside the 61.5% share of generic work. Factoring generic work back in, employees continue to spend most of their time on core domain duties and shared tasks.
Task crossover represents an addition to daily work, not a replacement of role responsibilities.
This contextual adjustment appears on page 15, twelve pages after the headline figures on page 3.
Two core questions raised by the report
If core responsibilities remain intact, where do the practical impacts lie? The conclusion highlights two structural questions without offering definitive answers.
First: If workers routinely use AI to perform tasks outside their domain, will this evolve into permanent job role expansion? If so, organizations must train staff to evaluate AI outputs outside their expertise and establish clear verification and governance workflows.
Consider practical scenarios: When a marketing specialist uses AI to patch website code, who verifies the fix? When a customer service rep drafts a regulatory response using AI, who signs off? In Table 2, 21.4% of regulatory communication tasks originated from CX prompts. The report highlights this operational challenge without prescribing solutions.
Second: Official labor databases log job duties based on historical standards. As AI alters task distribution, classification frameworks like O*NET risk falling out of step with actual workplace practices.
Historically, task blurring precedes new job titles
A key observation in the background section highlights why this dataset is significant:
Analysis of Generative AI usage offers a window into an earlier stage of the job evolution process, as workers can begin testing and recombining tasks before firms revise job descriptions or invent new job titles altogether.
Work at the Frontier, p. 4
Traditional economic research tracks job evolution long after changes surface in hiring ads, job titles, and labor statistics. This prompt data captures an earlier phase: a designer prompting AI late at night for an engineering solution—an interaction invisible to HR records.
The three papers cited in the report connect this timeline:
| Study | Key Finding | Relevance to Prompt Data |
|---|---|---|
| Atalay et al. (2020) | A large share of job evolution occurs within existing job titles rather than through occupational shifts alone. | The title "Designer" can remain static while daily responsibilities undergo major shifts over time. |
| Gans (2026) | As task execution costs drop, firms may unbundle jobs into narrower specialist roles or recombine them into broader generalist roles. | Both trajectories appear in the data: design trends generalist, while engineering tasks unbundle outward. |
| Autor, Chin et al. (2024) | Technological shifts generate new categories of work that eventually enter official classifications. | Task blurring is a transition state: over an 80-year span, most modern jobs did not exist in 1940. |
All three studies are cited in the report's background section. Co-author Caroline Chin also co-authored New Frontiers: The Origins and Content of New Work, 1940–2018.
Together, these studies contextualize the report: occupational boundaries have been evolving for decades, and prompt data captures a real-time snapshot of that ongoing shift.
How changes may surface first
The following scenario represents an analytical synthesis based on report data rather than an explicit report forecast.
As crossover persists, initial shifts will likely appear not in formal job titles, but in day-to-day requirements. Preferred qualifications in job postings will expand—a customer support role seeking basic SQL literacy, or a design role seeking analytics comprehension. Performance evaluations will encounter blurred attribution for shared deliverables. Training budgets will partially pivot from deep domain specialization toward verifying cross-functional AI outputs.
Accountability will present the primary friction. When a customer service employee uses AI to draft a regulatory response, does legal review every submission? Mandating review recreates bottlenecks; skipping review creates risk. The report identifies this operational dilemma, which organizations must navigate through internal process design.
The report's most grounded finding appears in the appendix: task crossover adds to daily work rather than replacing core roles. Across all eight occupations, 65%–82% of activity remains centered on own-domain and shared tasks.
The shift occurs at the periphery—where boundaries are becoming permeable. The headline figures detailing how AI changes work are calculated from that expanding fringe.
OpenAI Counted 800,000 Work Messages: The 43.5% Figure Comes from Dropping 60% of Data
OpenAI's Economic Research team analyzed task crossover across eight occupations. A shift in the baseline denominator changes the conclusion—here is the breakdown on a single page.
↓ One-page overview · Includes animated diagram
On July 27, 2026, OpenAI's Economic Research team released Work at the Frontier, examining over 800,000 work-related ChatGPT messages to determine how much AI usage falls outside workers' official job descriptions.
The report terms this phenomenon task crossover: tasks historically tied to one role showing up in the AI conversations of employees in another. Task ownership is benchmarked using O*NET, the US Department of Labor's national occupational database.
While headlines highlight 43.5%, the report also details a 16.8% raw figure. The difference stems entirely from denominator selection: filtering out the 61.5% share of generic work (emails, meetings, editing) and re-basing the remaining 38.5% specialized prompts to 100% transforms 16.8% into 43.5%.
The exact same crossover data point (animated dot above) shifts from 16.8% to 43.5% based on denominator selection. The report clearly indicates "rebased to 100%" and "excluding generic work"; secondary coverage omitted this context.
When evaluated strictly on specialized prompts, task crossover exceeds 50% in five of eight occupations, with nearly a threefold gap between the highest and lowest roles.
For the top five dark-colored roles, specialized AI prompts focus more often on external tasks than own-domain work. Engineering's 28% figure reflects high internal coding prompt volume expanding its denominator rather than a lack of task crossover.
Task crossover operates in two directions: Tasks brought in (external tasks in role prompts) and Tasks that travel (role tasks in external prompts).
Both sides drawn to a common scale (max 40%). Three patterns emerge: Design integrates work from multiple domains while exporting very little; Engineering retains strong internal focus while exporting tasks outward; Marketing sees high activity in both directions.
When generic work is reassigned to each role's own baseline, 65%–82% of all activity across all eight occupations remains centered on own-domain and shared work (Engineering 82% max, Design 65% min). Task crossover adds to existing roles rather than replacing them.
Crossover = 43.5%
CX 77% / Design 75%
Own + Shared = 65%–82%
CX 70% / Design 65%
Running a solo biz, Xiaohu handles support, design, and code. Then a viral headline catches his eye.
boiled it down to
Doing work
for other roles
Two numbers from the same data. Out of 100 work prompts, 61.5 are generic tasks everyone does.
all generic work
- × Writing emails
- × Scheduling
- × Editing copy
16.8 over 38.5 equals
across 8 roles
CX 77%
Design 75%
HR 69%
...
Eng 28%
Engineers prompt
so much code
it inflates
the denominator
Put generic tasks back into each role's baseline and recalculate.
+ shared work
–82%
Shifts happen along the outer edges. Headline AI numbers are calculated from that expanding fringe.