Have Chinese AI models caught up to the US frontier?
- Have Chinese models caught the US frontier? By Epoch's capability index (ECI), not yet: Kimi K3 still trails by 4.37 to 5.29 months, and the trend line never shows a crossover.
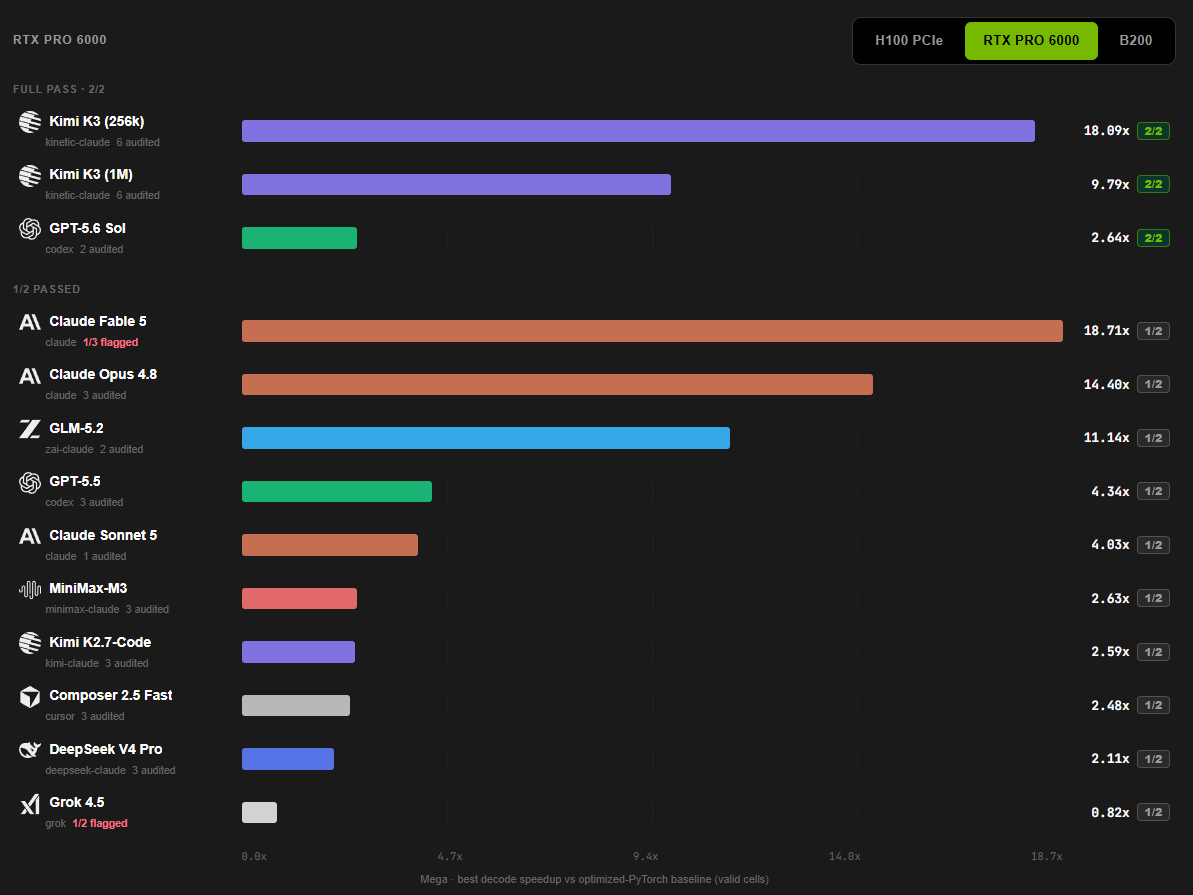
- The "caught up" claim isn't baseless either. Moonshot's own numbers show wins over Claude Opus 4.8 on 30 of 35 benchmarks, first place in the frontend coding arena, and GPU kernel optimization on par with Claude Fable 5.
- But those results depend entirely on which tests were picked. Of the 35 self-reported benchmarks, 24 are vision or agentic; there's no long context, no serious math, nothing on safety, and not a single measure of token efficiency in reasoning.
- The Artificial Analysis Index carries the same skew: Agents at 34% plus Coding at 24% puts 58% of the weight on agents and short coding tasks — and it ignores how hard each benchmark actually is.
- Epoch AI's ECI takes a different route, borrowing from educational testing: estimate each benchmark's difficulty and discriminating power, then back out a capability score that puts every model on one shared scale. Anthropic uses the same method in its own system cards.
- The two sticks give opposite answers. On AAI, China trails by 1.22 to 1.61 months and overtakes in November 2027. On ECI, it trails by 4.37 to 5.29 months with no crossover on the trend line. Even the speed ranking of the seven labs is nearly reversed.
Not yet — but the leaderboards convinced a lot of people otherwise
The answer is not yet.
So the real question this analysis tackles is why there are two answers, and which one to believe. To see that clearly, start with how solid the evidence for "caught up" actually is — it's a lot harder than the usual talking points.
Start with Kimi K3's report card
Kimi K3 is the largest open-weight model to date, nearly twice the size of DeepSeek V4 and bigger than the original GPT-4 (1.8 trillion) that kicked off this whole AI wave. Across the 35 benchmarks Moonshot published itself, K3 beats Claude Opus 4.8 on 30, GPT-5.6 Sol on 19, and Claude Fable 5 on 12.
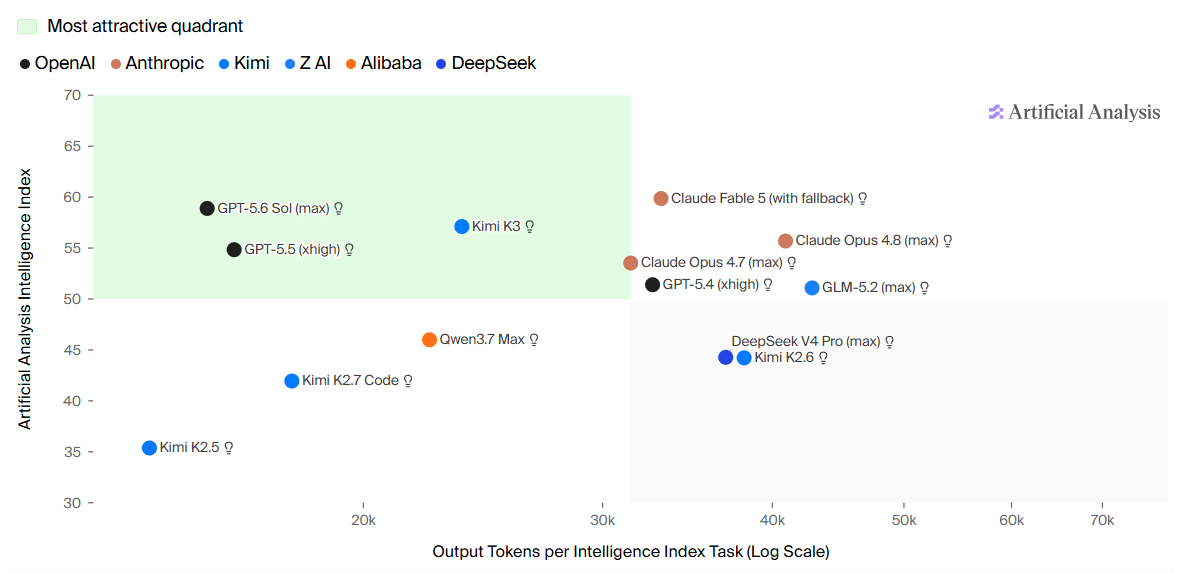
Third-party evaluations back up its position. On Artificial Analysis's leaderboard, Kimi K3 scores 57.1 — third behind Claude Fable 5 and GPT-5.6 Sol, a clear jump over the previous crop of Chinese flagships like GLM-5.2, Kimi K2.6, Qwen3.7-Max and DeepSeek-V4-Pro.
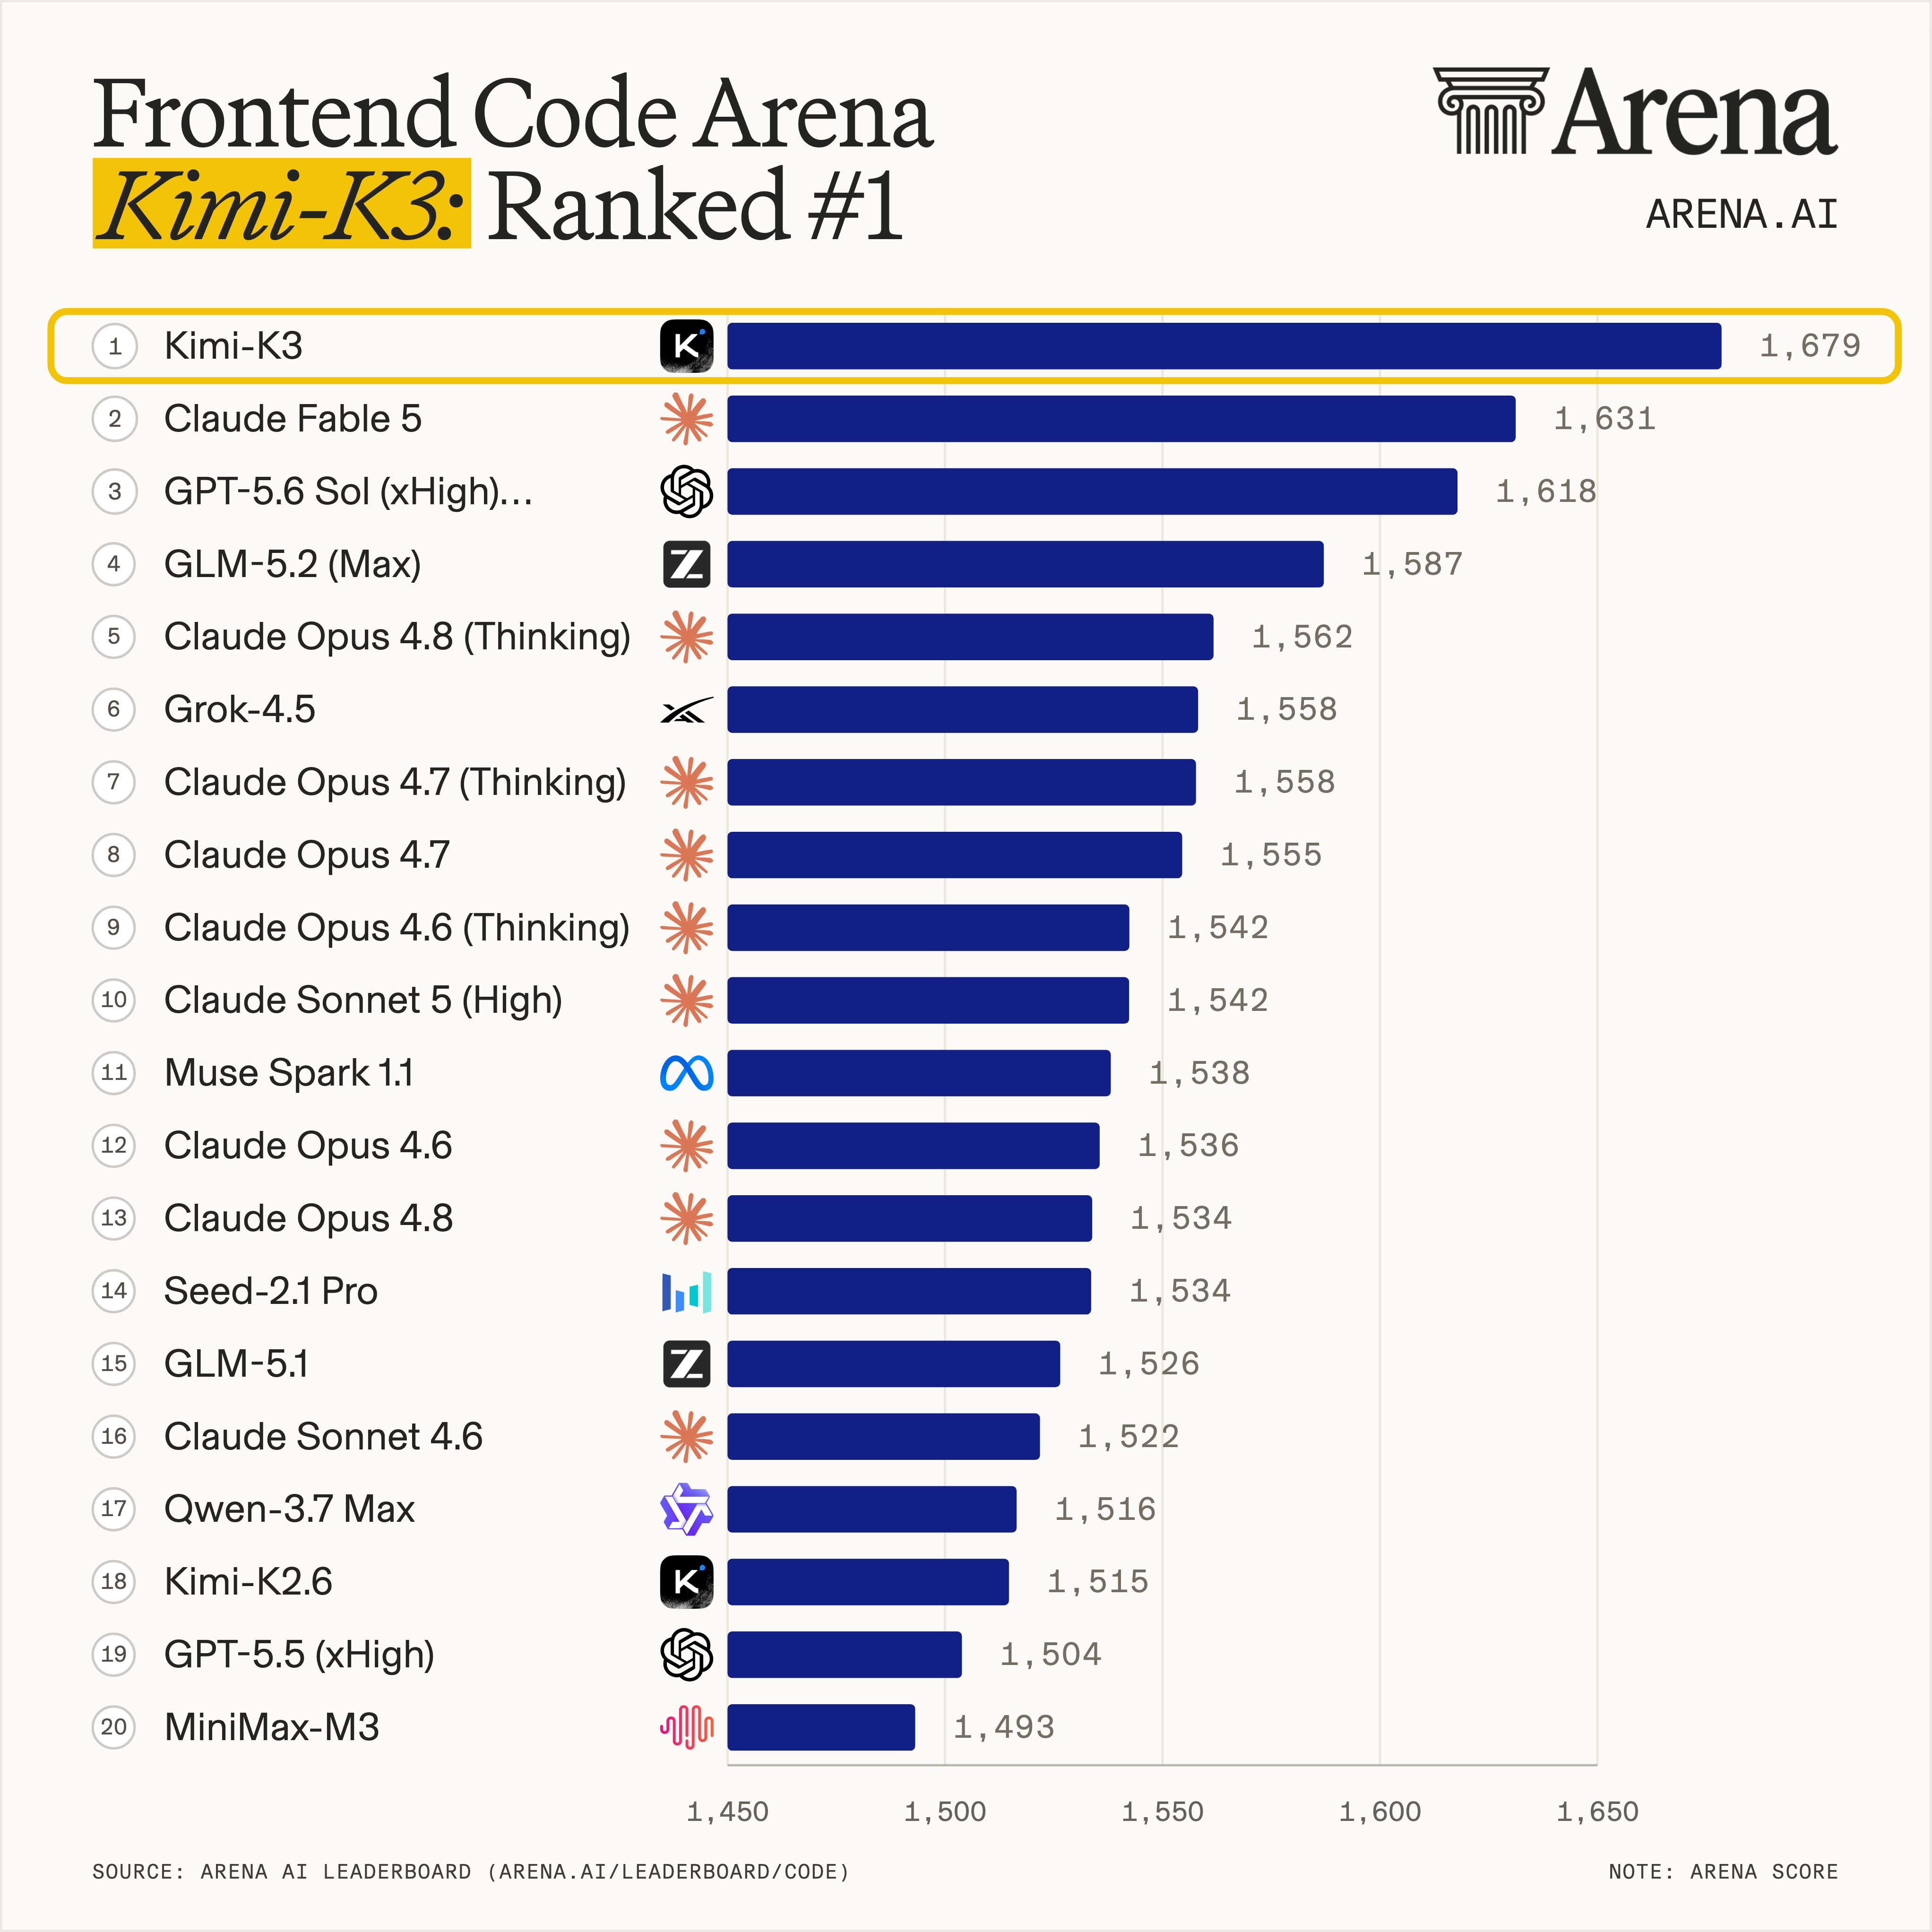
On Frontend Code Arena, which tests web front-end output specifically, Kimi K3 took first place with 1679, forty-eight points ahead of runner-up Claude Fable 5 — the largest gap anywhere on that board.
Then there's a domain that rarely makes headlines but matters enormously to anyone building AI: GPU kernel optimization. How fast a model runs depends on how cleanly the hardware gets squeezed, and every wasted clock cycle means less throughput, more latency, and ultimately more money. This matters in production, but it matters in research too — every new architecture idea needs a batch of experiments to validate, and plain PyTorch won't saturate the hardware. Hand-written kernels do.
Line all that up and "China has reached the US frontier" starts to look like a closed case. So where does that opening "not yet" come from? The first layer of the disagreement hides inside the word "capability."
Break capability apart and only one area has actually converged
"They caught up" can be proven and disproven at the same time because capability was never one thing. A model can match its rivals at writing code while lagging generations behind elsewhere. Lay out every domain this analysis touches and the unevenness jumps out.
Coding happens to be the most visible domain: it has the most public leaderboards, and it's the capability everyone touches daily. The rows below it either require a dedicated evaluation lab to run or never made the self-reported list at all. The public "they caught up" narrative grows almost entirely out of that first row.
And coding is exactly the row that matters most
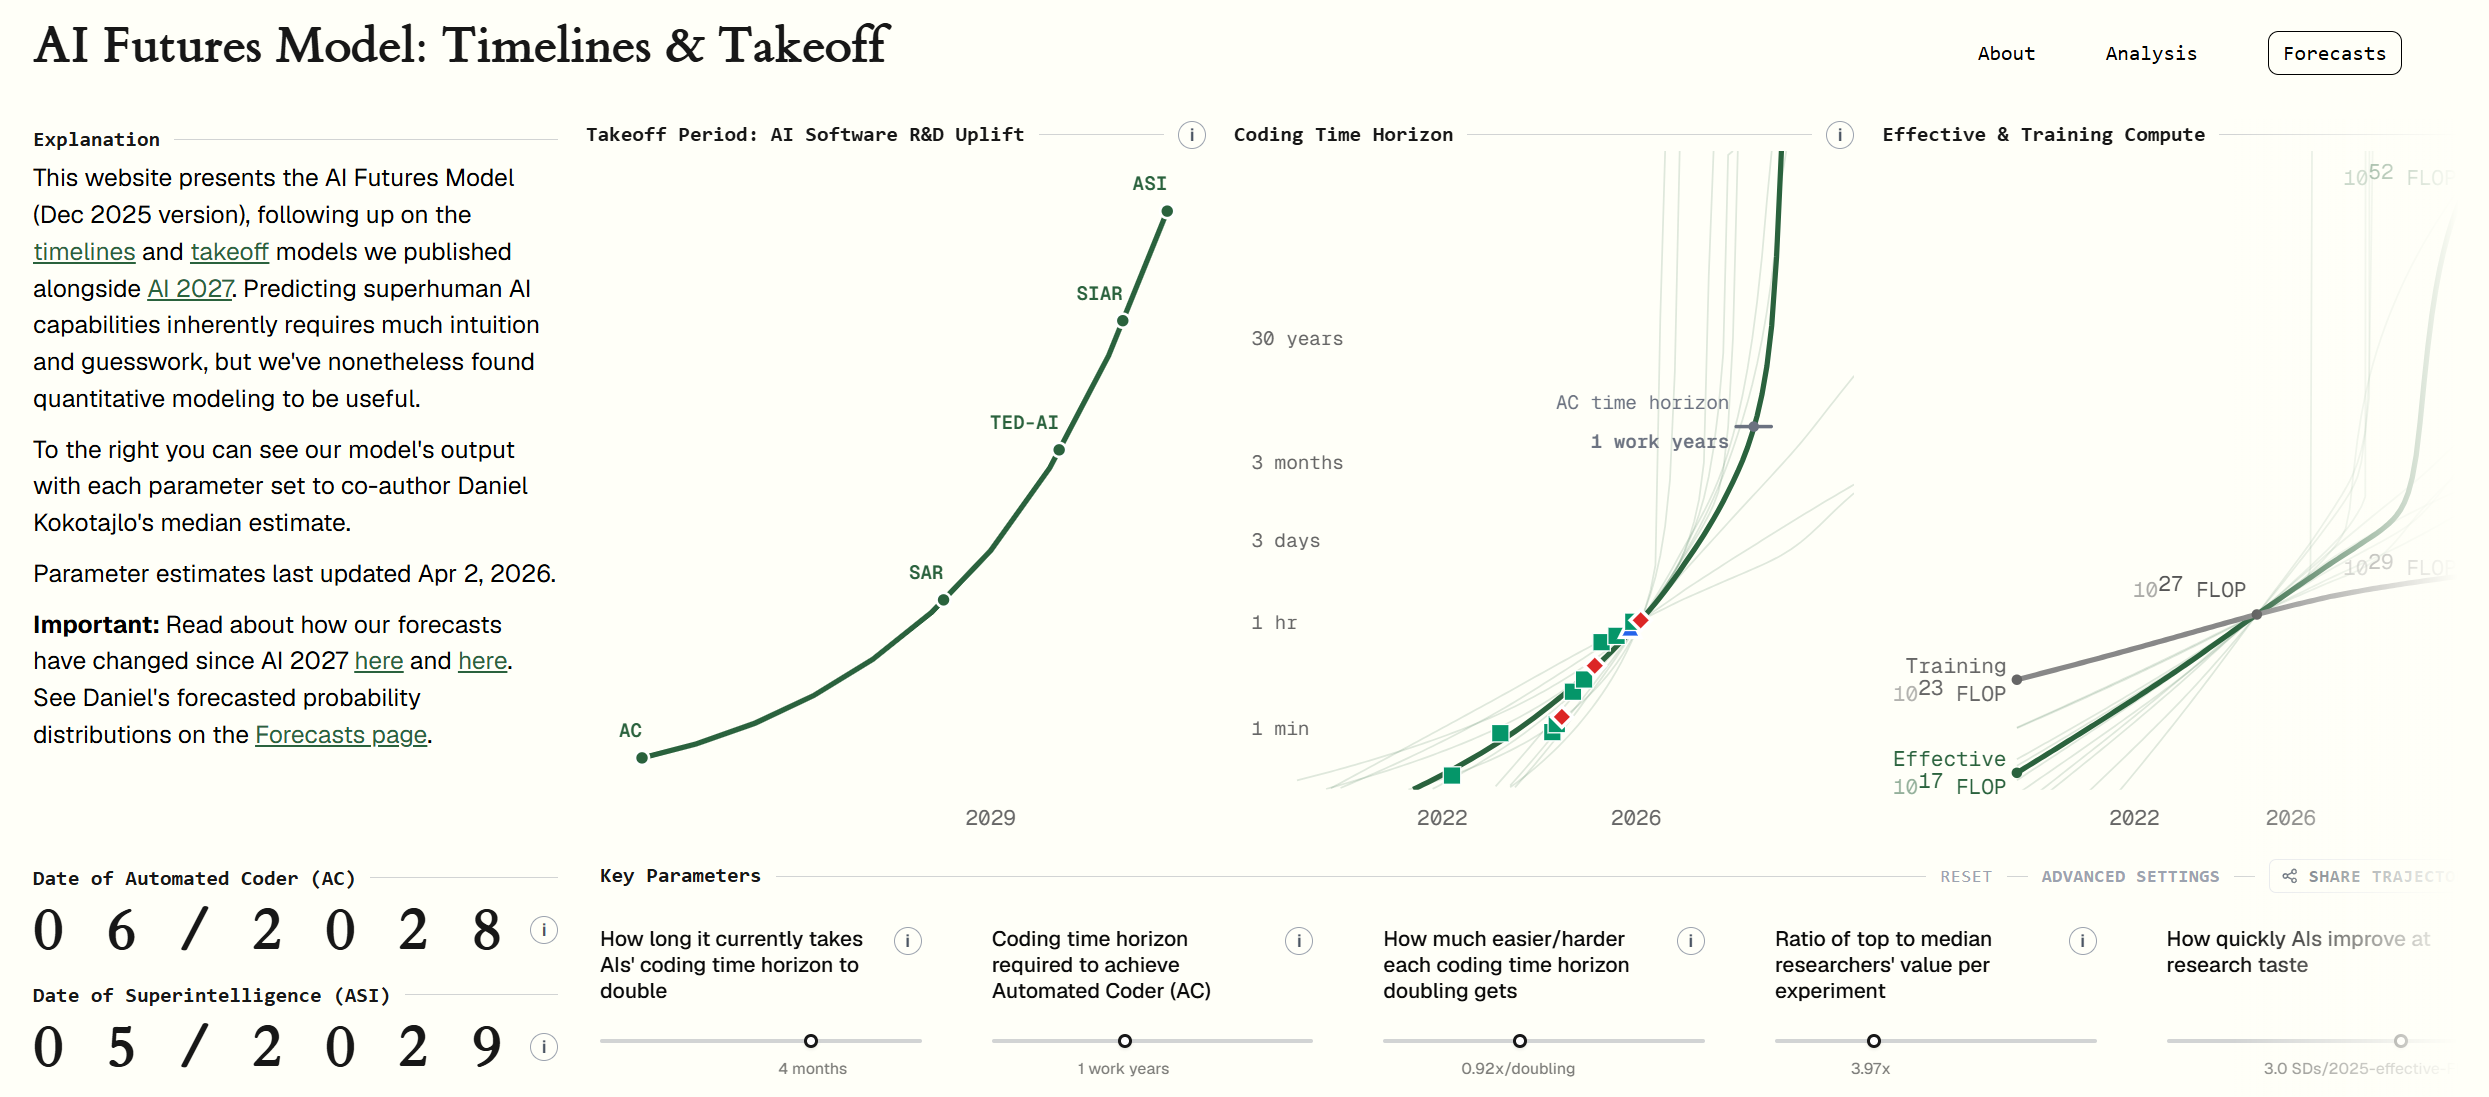
The best-measured trend in the field lives in software engineering: the length of task an AI can complete on its own roughly doubles every 4 months. The author notes this likely holds in other domains such as math too — software engineering is just where the measurement is most thorough. That "task length" has a proper name: time horizon.
Take a task that would take a human some amount of time, and find the duration at which the model has a 50% chance of completing it. That duration is the model's time horizon. As a difficulty yardstick it beats counting lines of code, and it converts directly into economic value: handling a day of someone's work and handling three months of it are entirely different propositions.
Extend that trend two or three years and you land at models taking on work that would occupy a person for months or years. Even if the trend only holds for coding, whoever first controls a superhuman-programmer model controls a strategic position that's very hard to erase. That's why it's worth doing the arithmetic on those few months of gap.
The comparison covers only the US and China because that's where the best models, the most AI research, and the most compute all sit. Europe has the money and the people in principle, but so far has shown no real intent to compete.
Which raises the question: if the per-domain gaps are this obvious, how does it all come out as "parity" on the leaderboards? Two more layers explain it. The first is the word "gap" itself — it's quietly doing two jobs, and most people only use one of them.
The word "gap" is doing two jobs at once
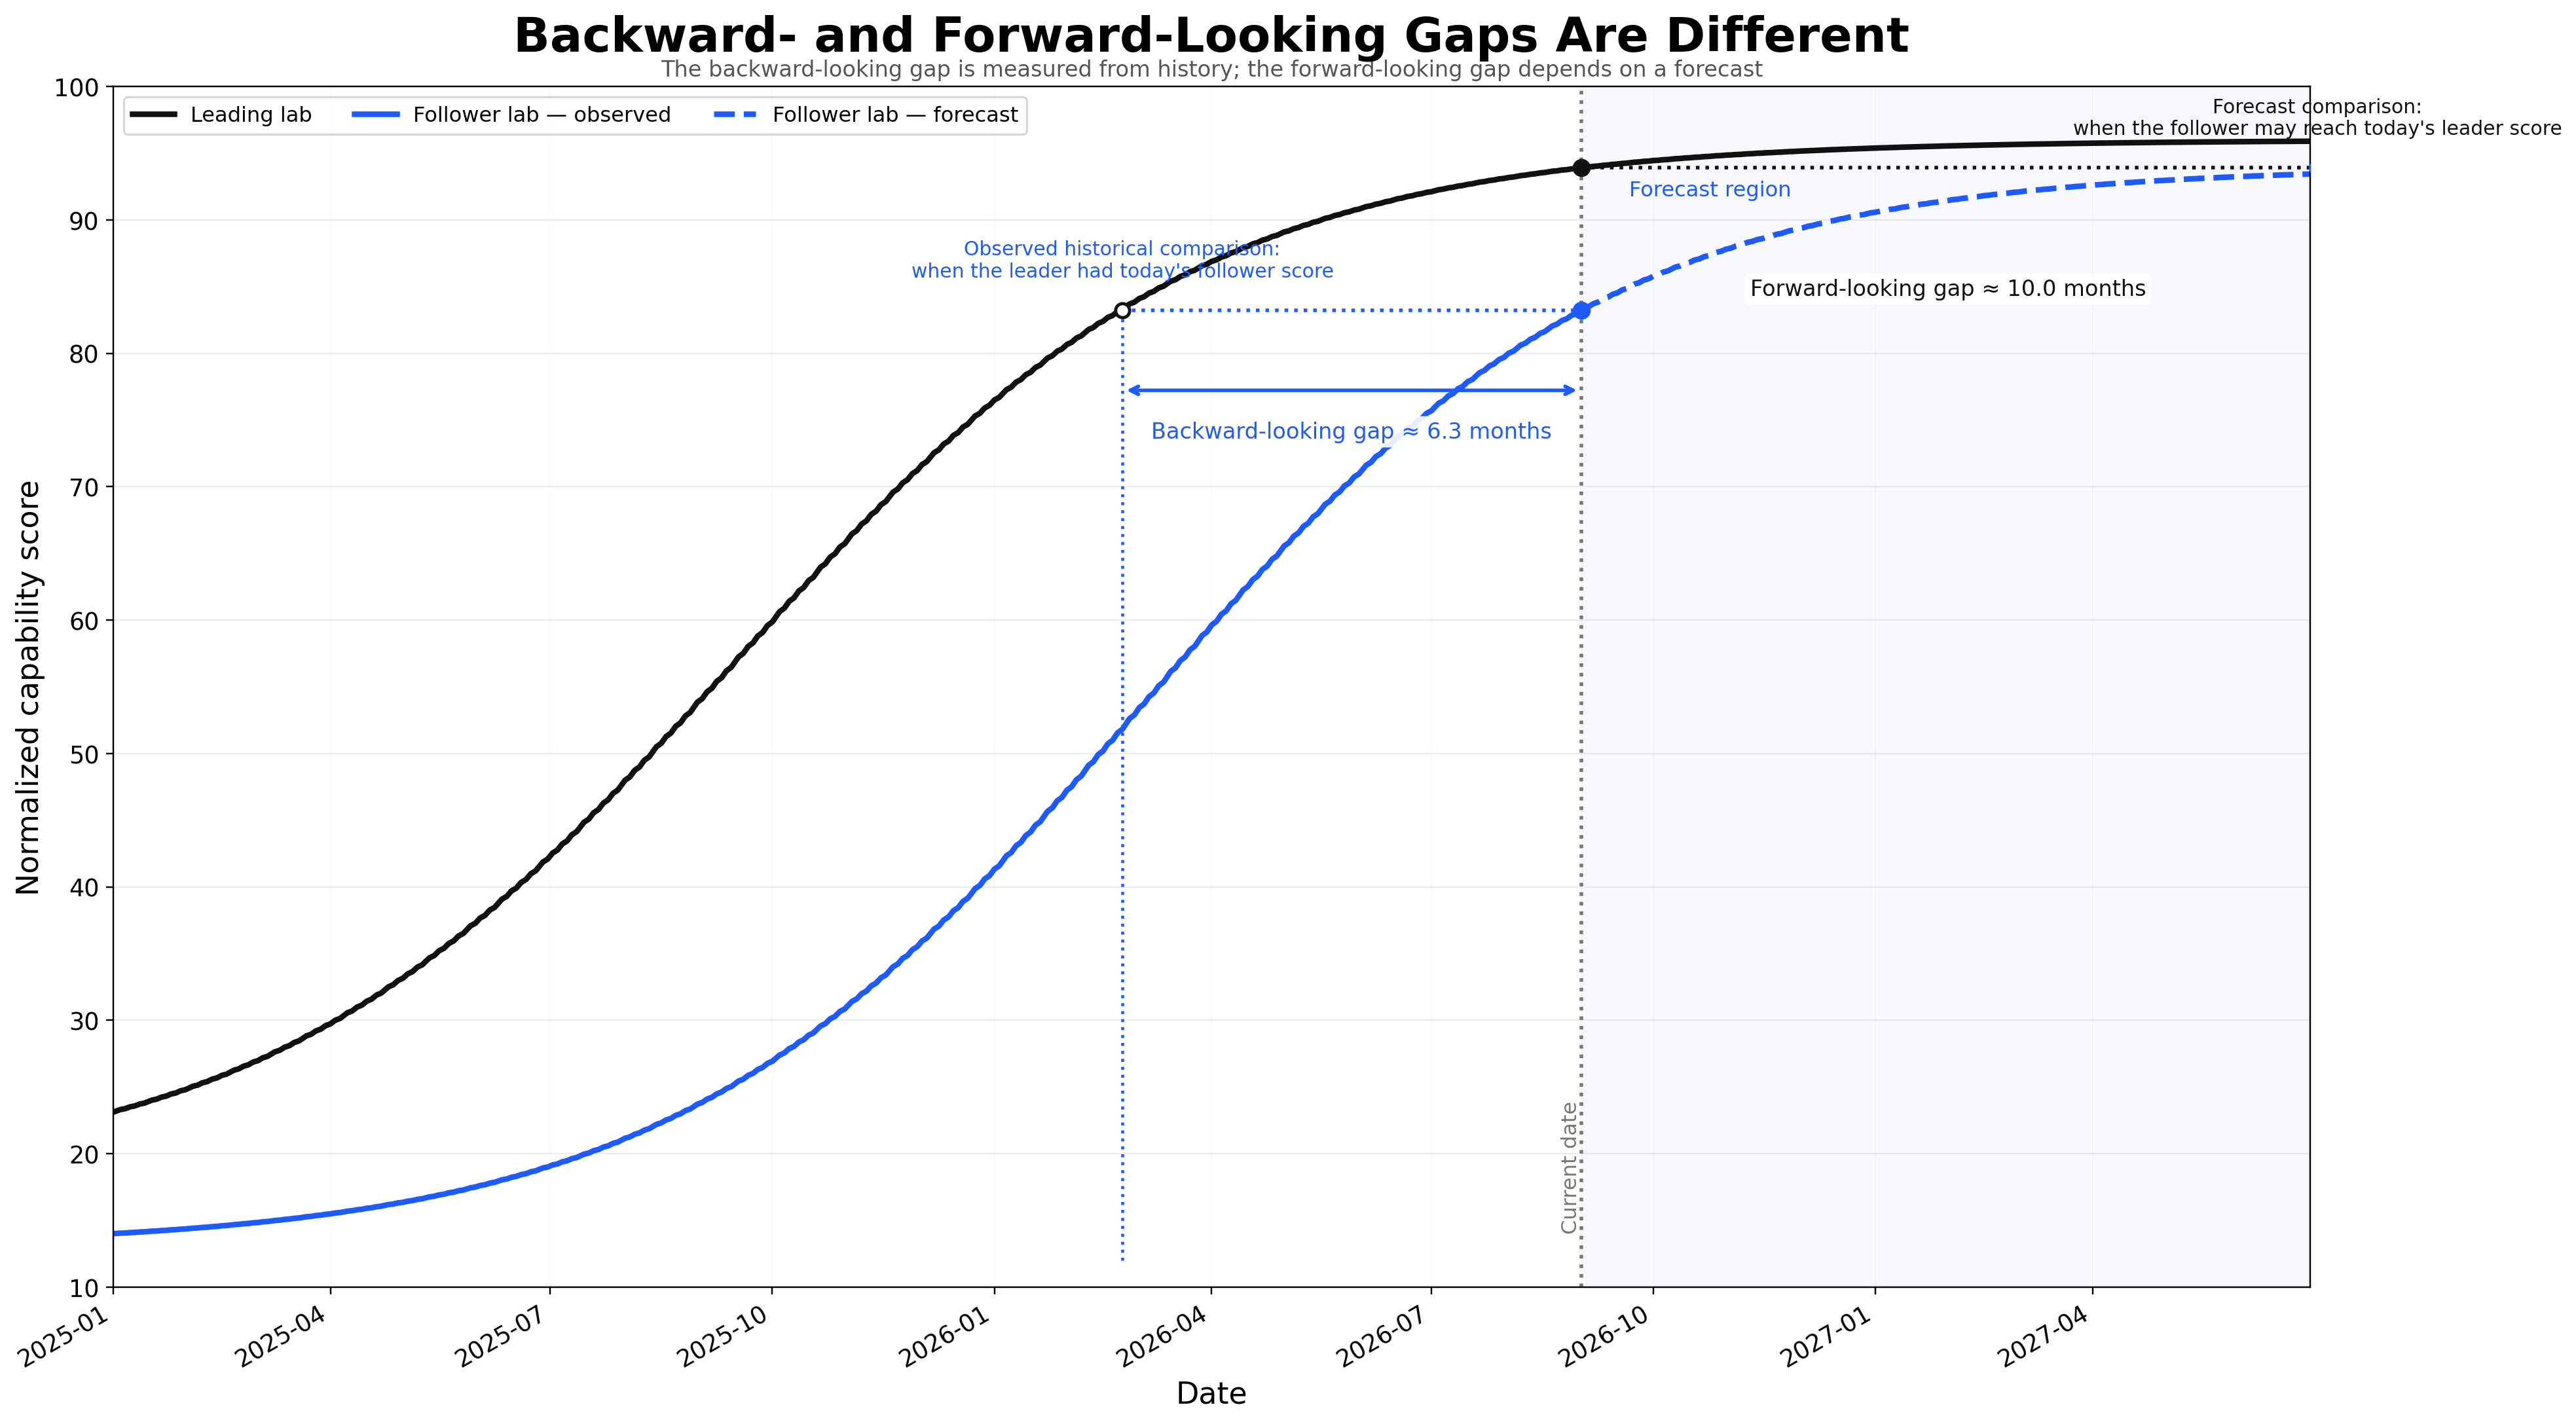
The definition fits in one sentence: how long it takes one lab to build a capability another lab already has. But that sentence contains two questions pointing in opposite directions.
- How long ago did the leader sit where the trailer sits today?
- Computable from history — all the data has already happened.
- This is what people usually mean by "a few months behind."
- How long until the trailer reaches where the leader is today?
- Requires forecasting — it depends on assumptions about compute, talent, and AI-driven acceleration.
- Far more uncertain.
One more layer gets skipped a lot: capability is domain-specific. A model can match another at writing code and still lose elsewhere, or lose on aggregate. So "caught up" always demands a follow-up — caught up at what?
Models ship in batches, so there's no continuous curve
Try to compute any of this and you hit a practical problem: progress is discrete. Models appear every few weeks to months, and two models never score exactly the same, so there's no way to measure the interval directly. Three approaches, each with a trade-off.
The author picked the third: it's symmetric, it better reflects the underlying trend, and it reveals whether the gap is widening or narrowing. The cost is stated plainly too — the result depends on which regression model you choose, and it smooths away discontinuities in the trend. That works against Kimi K3: if K3 genuinely is a break in the trend, the regression will push it back down.
That said, over roughly the past five years only one or two events qualify as trend breaks: reasoning models in Q3 2024, and possibly the surge in agentic models after Claude Opus 4.5 shipped in November 2025. Neither had anything to do with model size, so the idea that a model less than twice the size of DeepSeek-V4-Pro breaks the trend on scale alone doesn't hold up well.
Every conclusion below therefore comes with two numbers: an adjacent-model range (the instantaneous gap right now, with an interpolated value inside the range on the charts) and a trend-line estimate (the long-run picture). With the method settled, we reach the second layer of the disagreement — the one that matters most: which questions you use to measure.
Which benchmarks make the list decides the conclusion
"Won 30 of 35" carries exactly as much weight as the selection process behind those 35. Break the composition down and the missing categories say more than the present ones.
- Vision: 12
- Agentic: 12
- Coding: 8
- "Reasoning" and knowledge: 3
- Long context: none at all
- Safety-relevant work — cyber, bio, chemical: none at all
- Serious math: only MathVision, GPQA-D and HLE
- Pure reasoning: the 3 filed under "reasoning" are knowledge questions with a bit of math
- Token efficiency in reasoning: none at all
Vision and agentic together account for 24 benchmarks — nearly seventy percent of the list. The coding group does contain a few the author considers high signal, such as ProgramBench and SWE-Marathon, which cover broader task scopes and longer horizons.
One claim holds: Kimi K3's coding ability is comparable to the current US frontier.
You cannot get to "Kimi K3 is stronger overall than Claude Opus 4.8 and GPT-5.6 Sol" from here. Against Claude Fable 5 it's not even close — K3 loses most of the 35.
Third-party leaderboards carry the same skew
What about the third-party Artificial Analysis Index? It's one of the most popular indices today, but the author argues it shouldn't be used to judge a model's overall strength, for two reasons.
First, the weighting. The index composition tilts heavily toward agents and short-horizon coding.
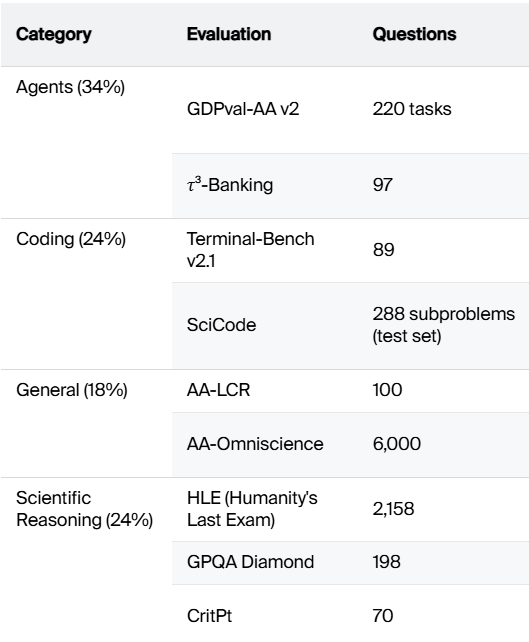
Second, difficulty. The index does nothing with how hard each evaluation is or how much information a given score carries. Everything gets averaged under hand-set weights, so a benchmark anyone can pass and a benchmark almost no model can solve count exactly the same.
That doesn't make it useless. Its rankings match how models feel in daily use, because it measures work with genuine economic value. The author's fix is to relabel it: treat it as a measure of everyday usefulness rather than general intelligence. That's why his piece calls it the Artificial Analysis Index, with the word Intelligence dropped from the official name. So is there a yardstick that skips hand-picked weights and factors in difficulty? There is — and Anthropic uses it too.
How ECI folds question difficulty into the score
Epoch AI's Capability Index (ECI) targets exactly those two flaws. It aims to measure the underlying general capability of a model and place every model on one shared scale. The technique is called Item Response Theory (IRT).
Two students both score 60. One took a grade-school test, the other took an olympiad paper. Those scores describe wildly different ability levels. To compare them at all, you first need to know how hard each paper was. That's what Item Response Theory does: the probability of getting a question right depends jointly on how strong the student is and how hard the question is, so estimate both together.
Applied to evaluations, each benchmark gets two parameters:
- How much capability it takes to score 50 on this benchmark.
- How sensitively the score responds to changes in capability — in other words, whether it can separate closely matched models.
With those parameters estimated, a single unified statistical model gets fitted to find the capability value that best explains all observed scores. That value is the model's ECI.
It reduces reliance on hand-picked weights; it doesn't require every model to have run every benchmark, so gaps are fine; and it accounts for both the difficulty and the discriminating power of each benchmark.
Anthropic recently adopted the same approach for measuring model strength, calling it AECI in its own system cards. Their chart also plots benchmark difficulty along the way.
Working through one cell shows what the method is doing. GPQA Diamond's 50-point mark lands near 129, meaning a model with capability around 129 should score roughly 50 there. Claude 3 Opus has an AECI of about 126 — slightly below 129 — so the model predicts it scores a bit under 50. It actually scored 50.4, a touch above expectation.
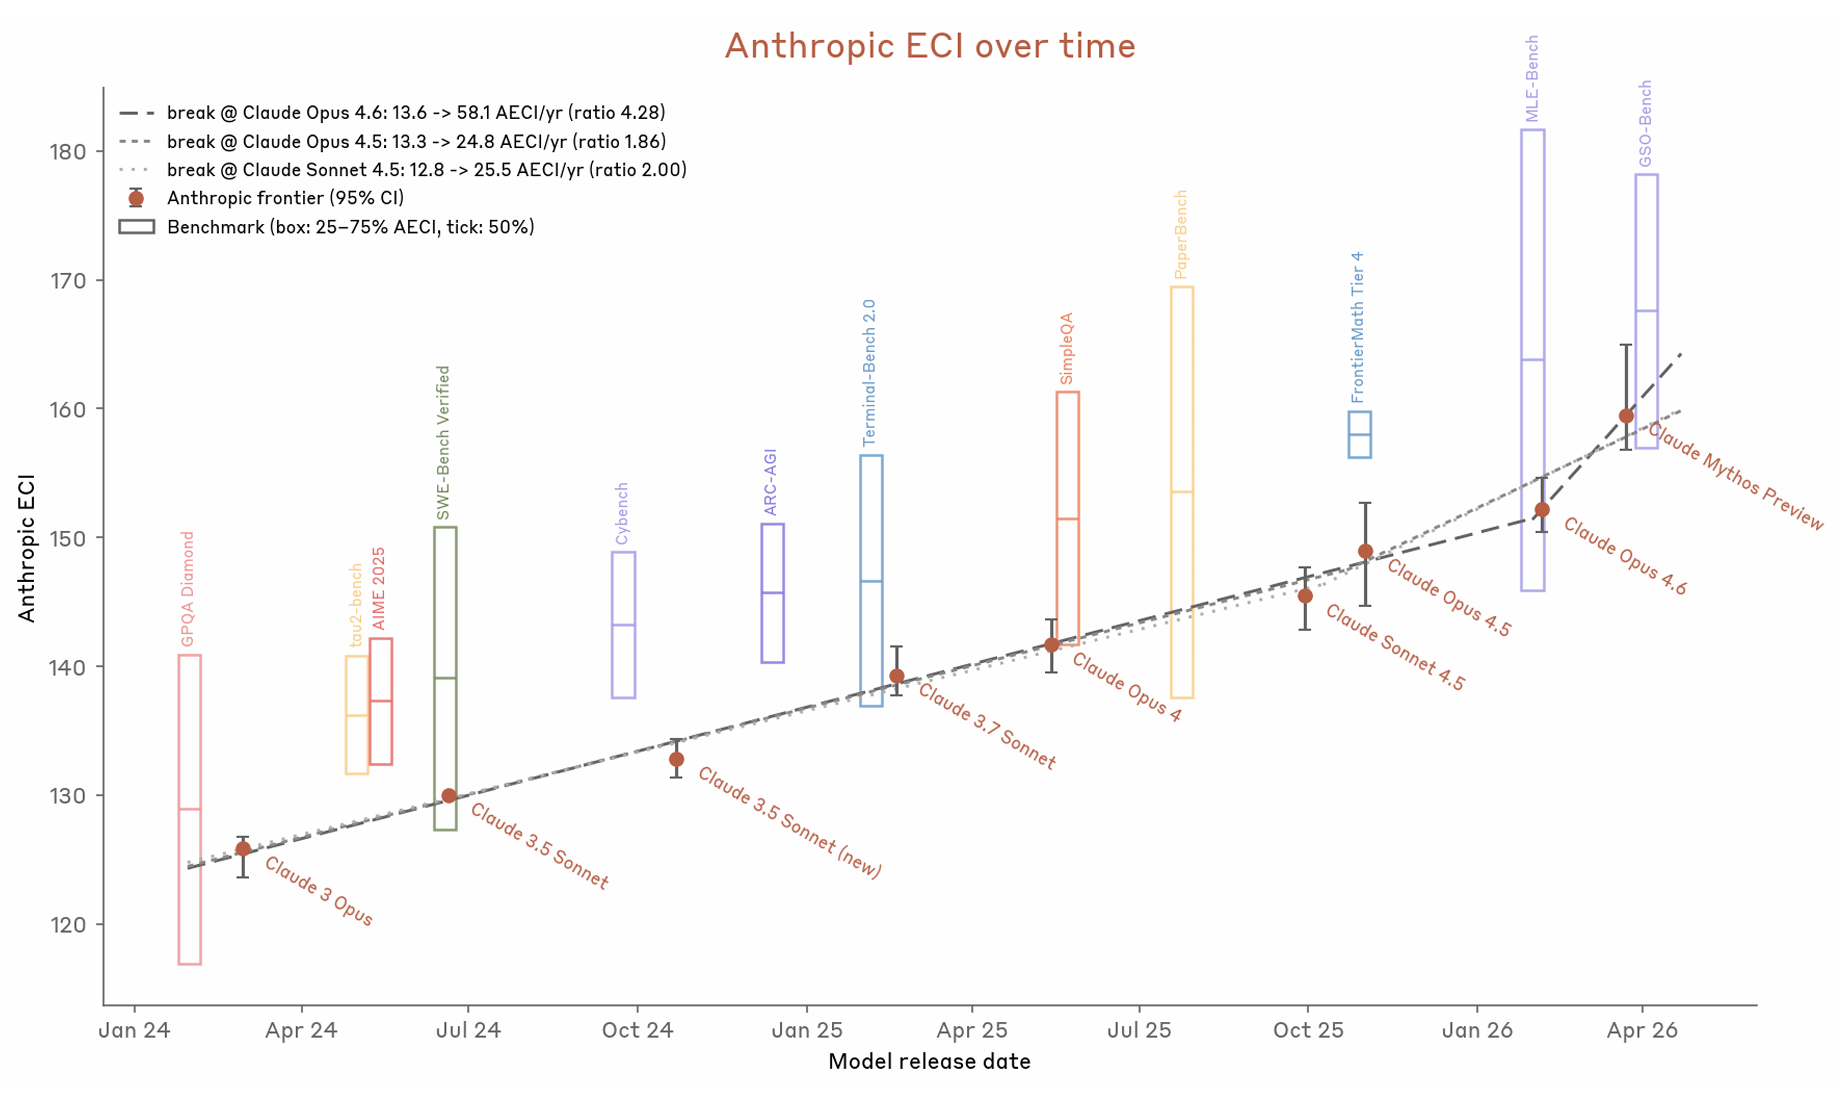
Capability values on one shared scale, with less bias than a hand-weighted index — that's what ECI buys you. With both yardsticks in hand, it's time to measure the same set of models with each.
Two yardsticks, same models, a gap that differs by more than 3x
Same models, same period. Change the measuring stick and both the size and the direction of the US-China gap change with it.
First, the AAI yardstick
Kimi K3 scores 57.1 on this index. Because the index is bounded between 0 and 100, the author fits each country's frontier trend with a sigmoid curve.
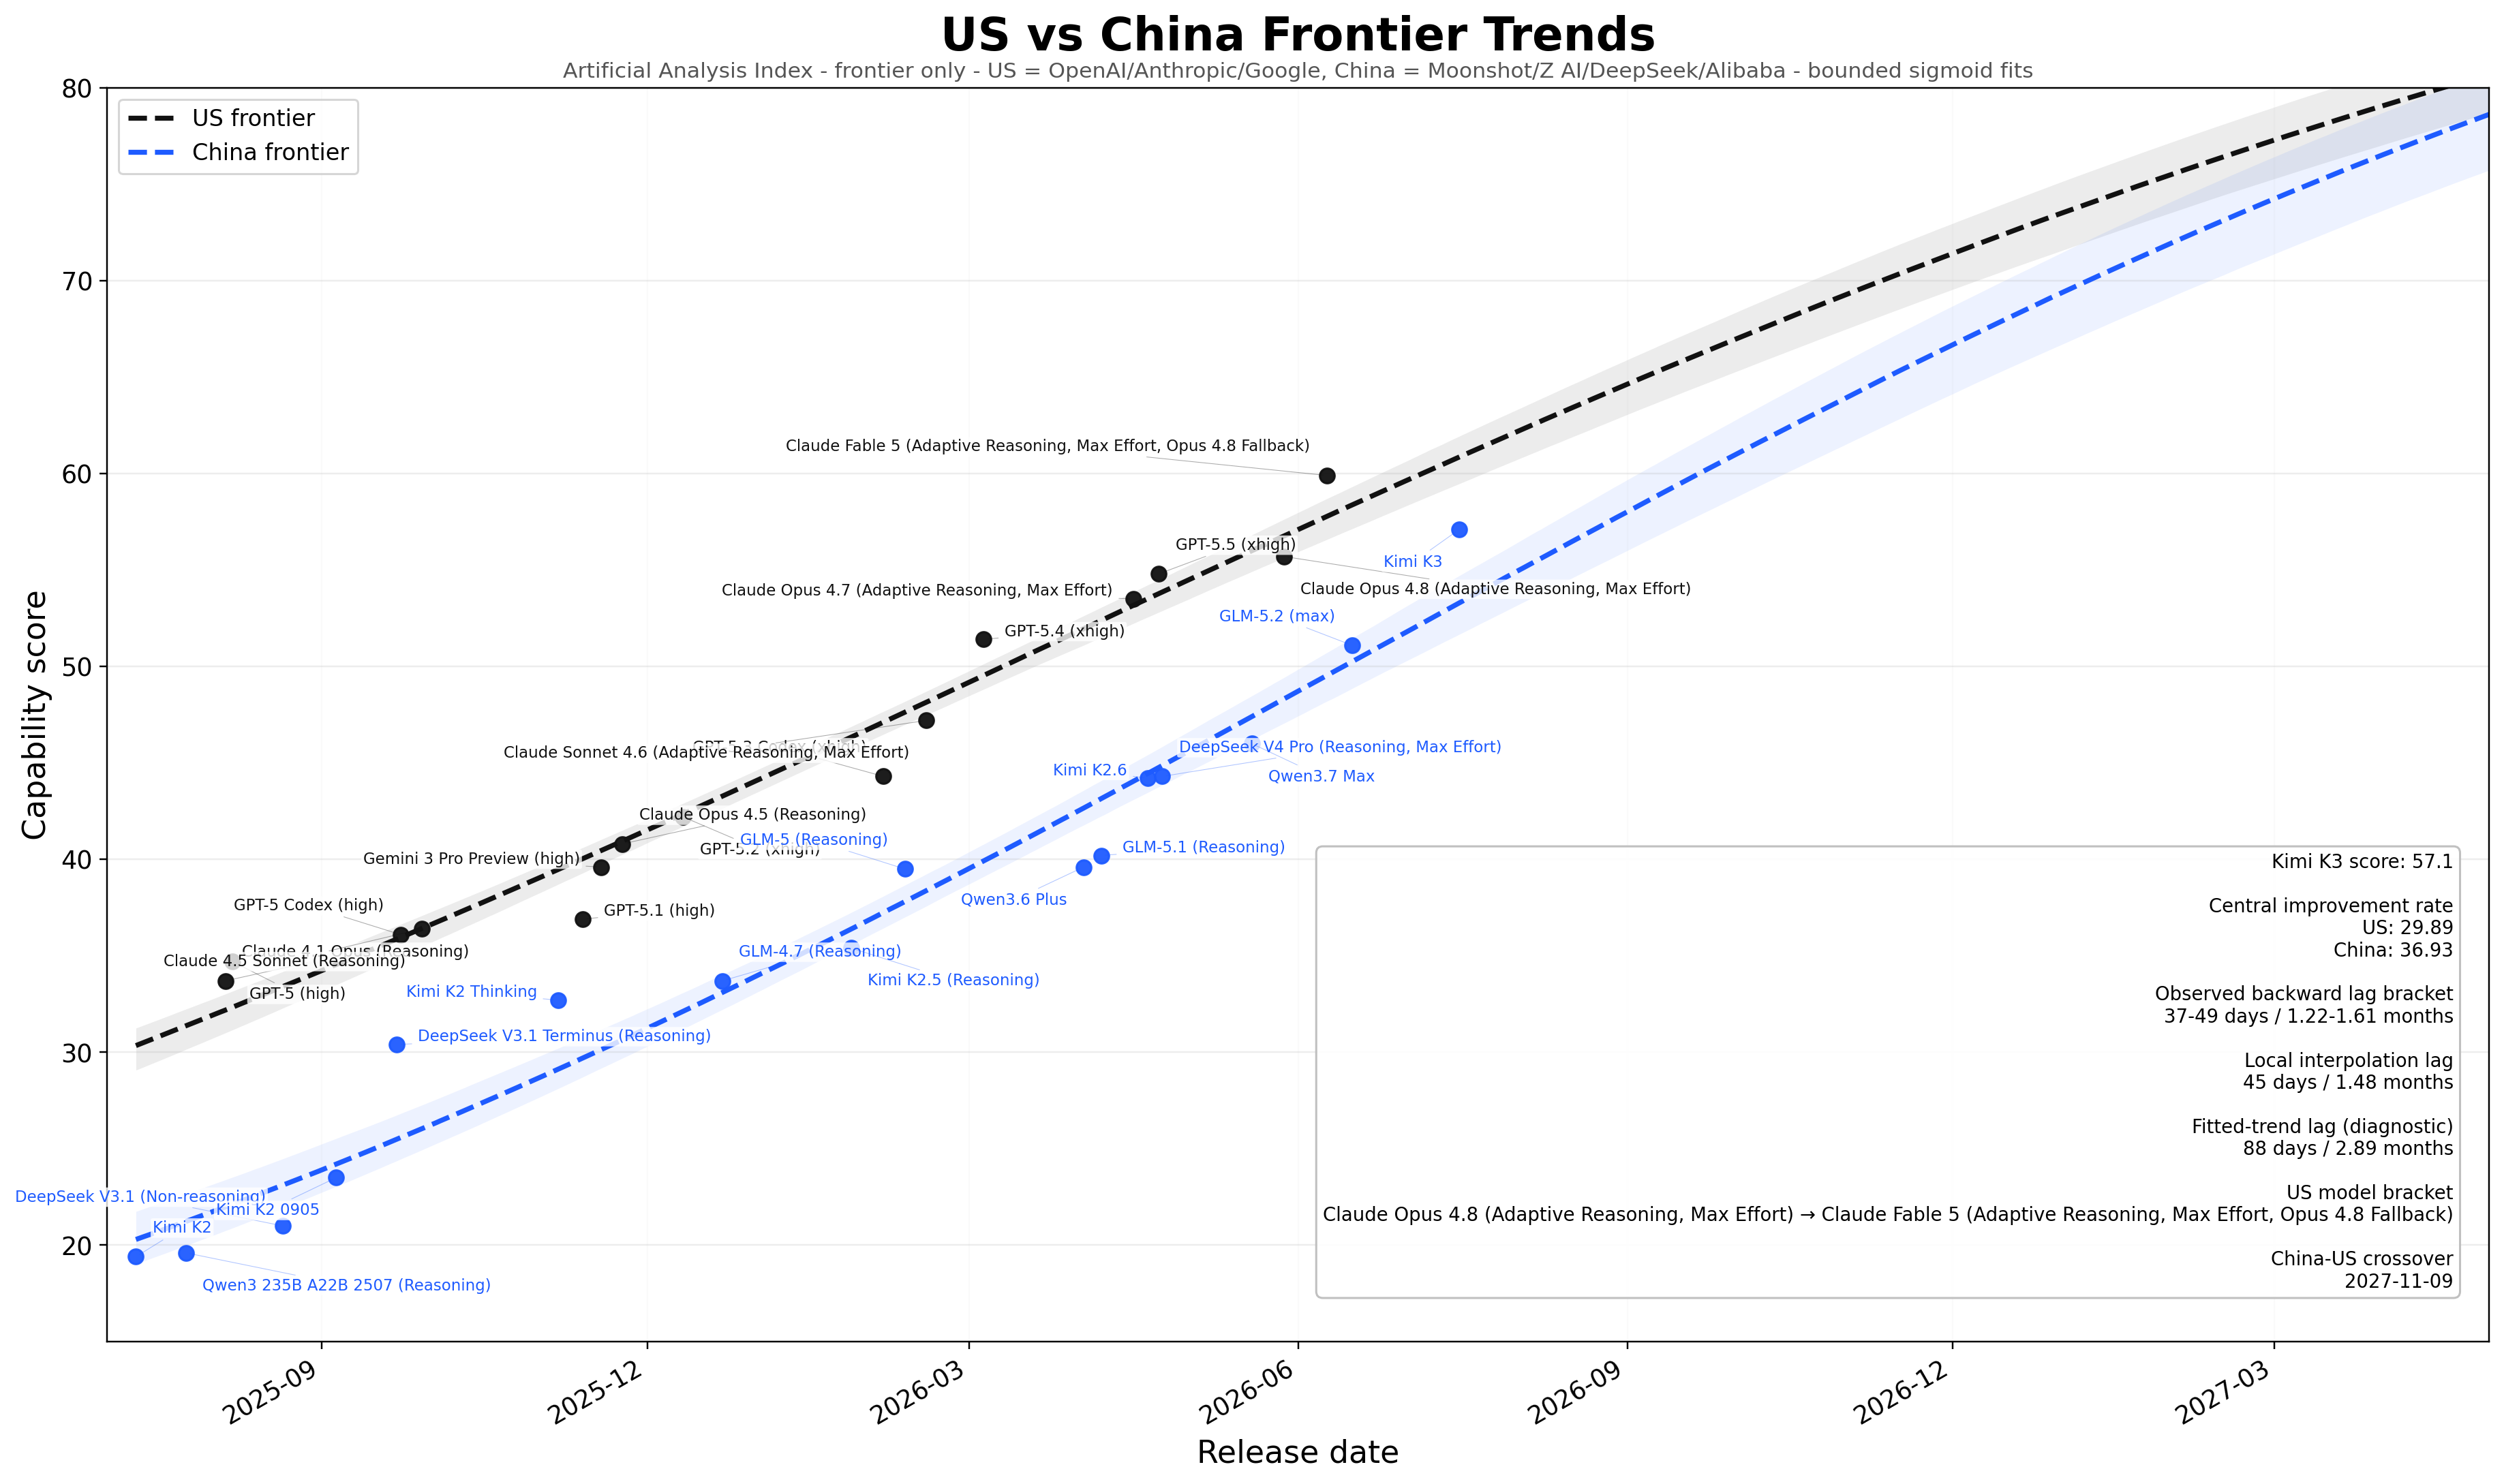
By this stick, the Chinese frontier trails the US frontier by a bit over a month, and extending the trend line puts the overtake on November 9, 2027.
Switch to ECI and the same models flip the conclusion
Once Epoch published preliminary scores for Kimi K3, combining them with Moonshot's published results gives 9 benchmarks — enough to fit its ECI directly: 155.53, with a 90% interval of 153.87 to 158.21. That figure is the author's own calculation, not an officially published Epoch ECI. It lands between GPT-5.3 Codex and GPT-5.4 Pro, closer to the former.
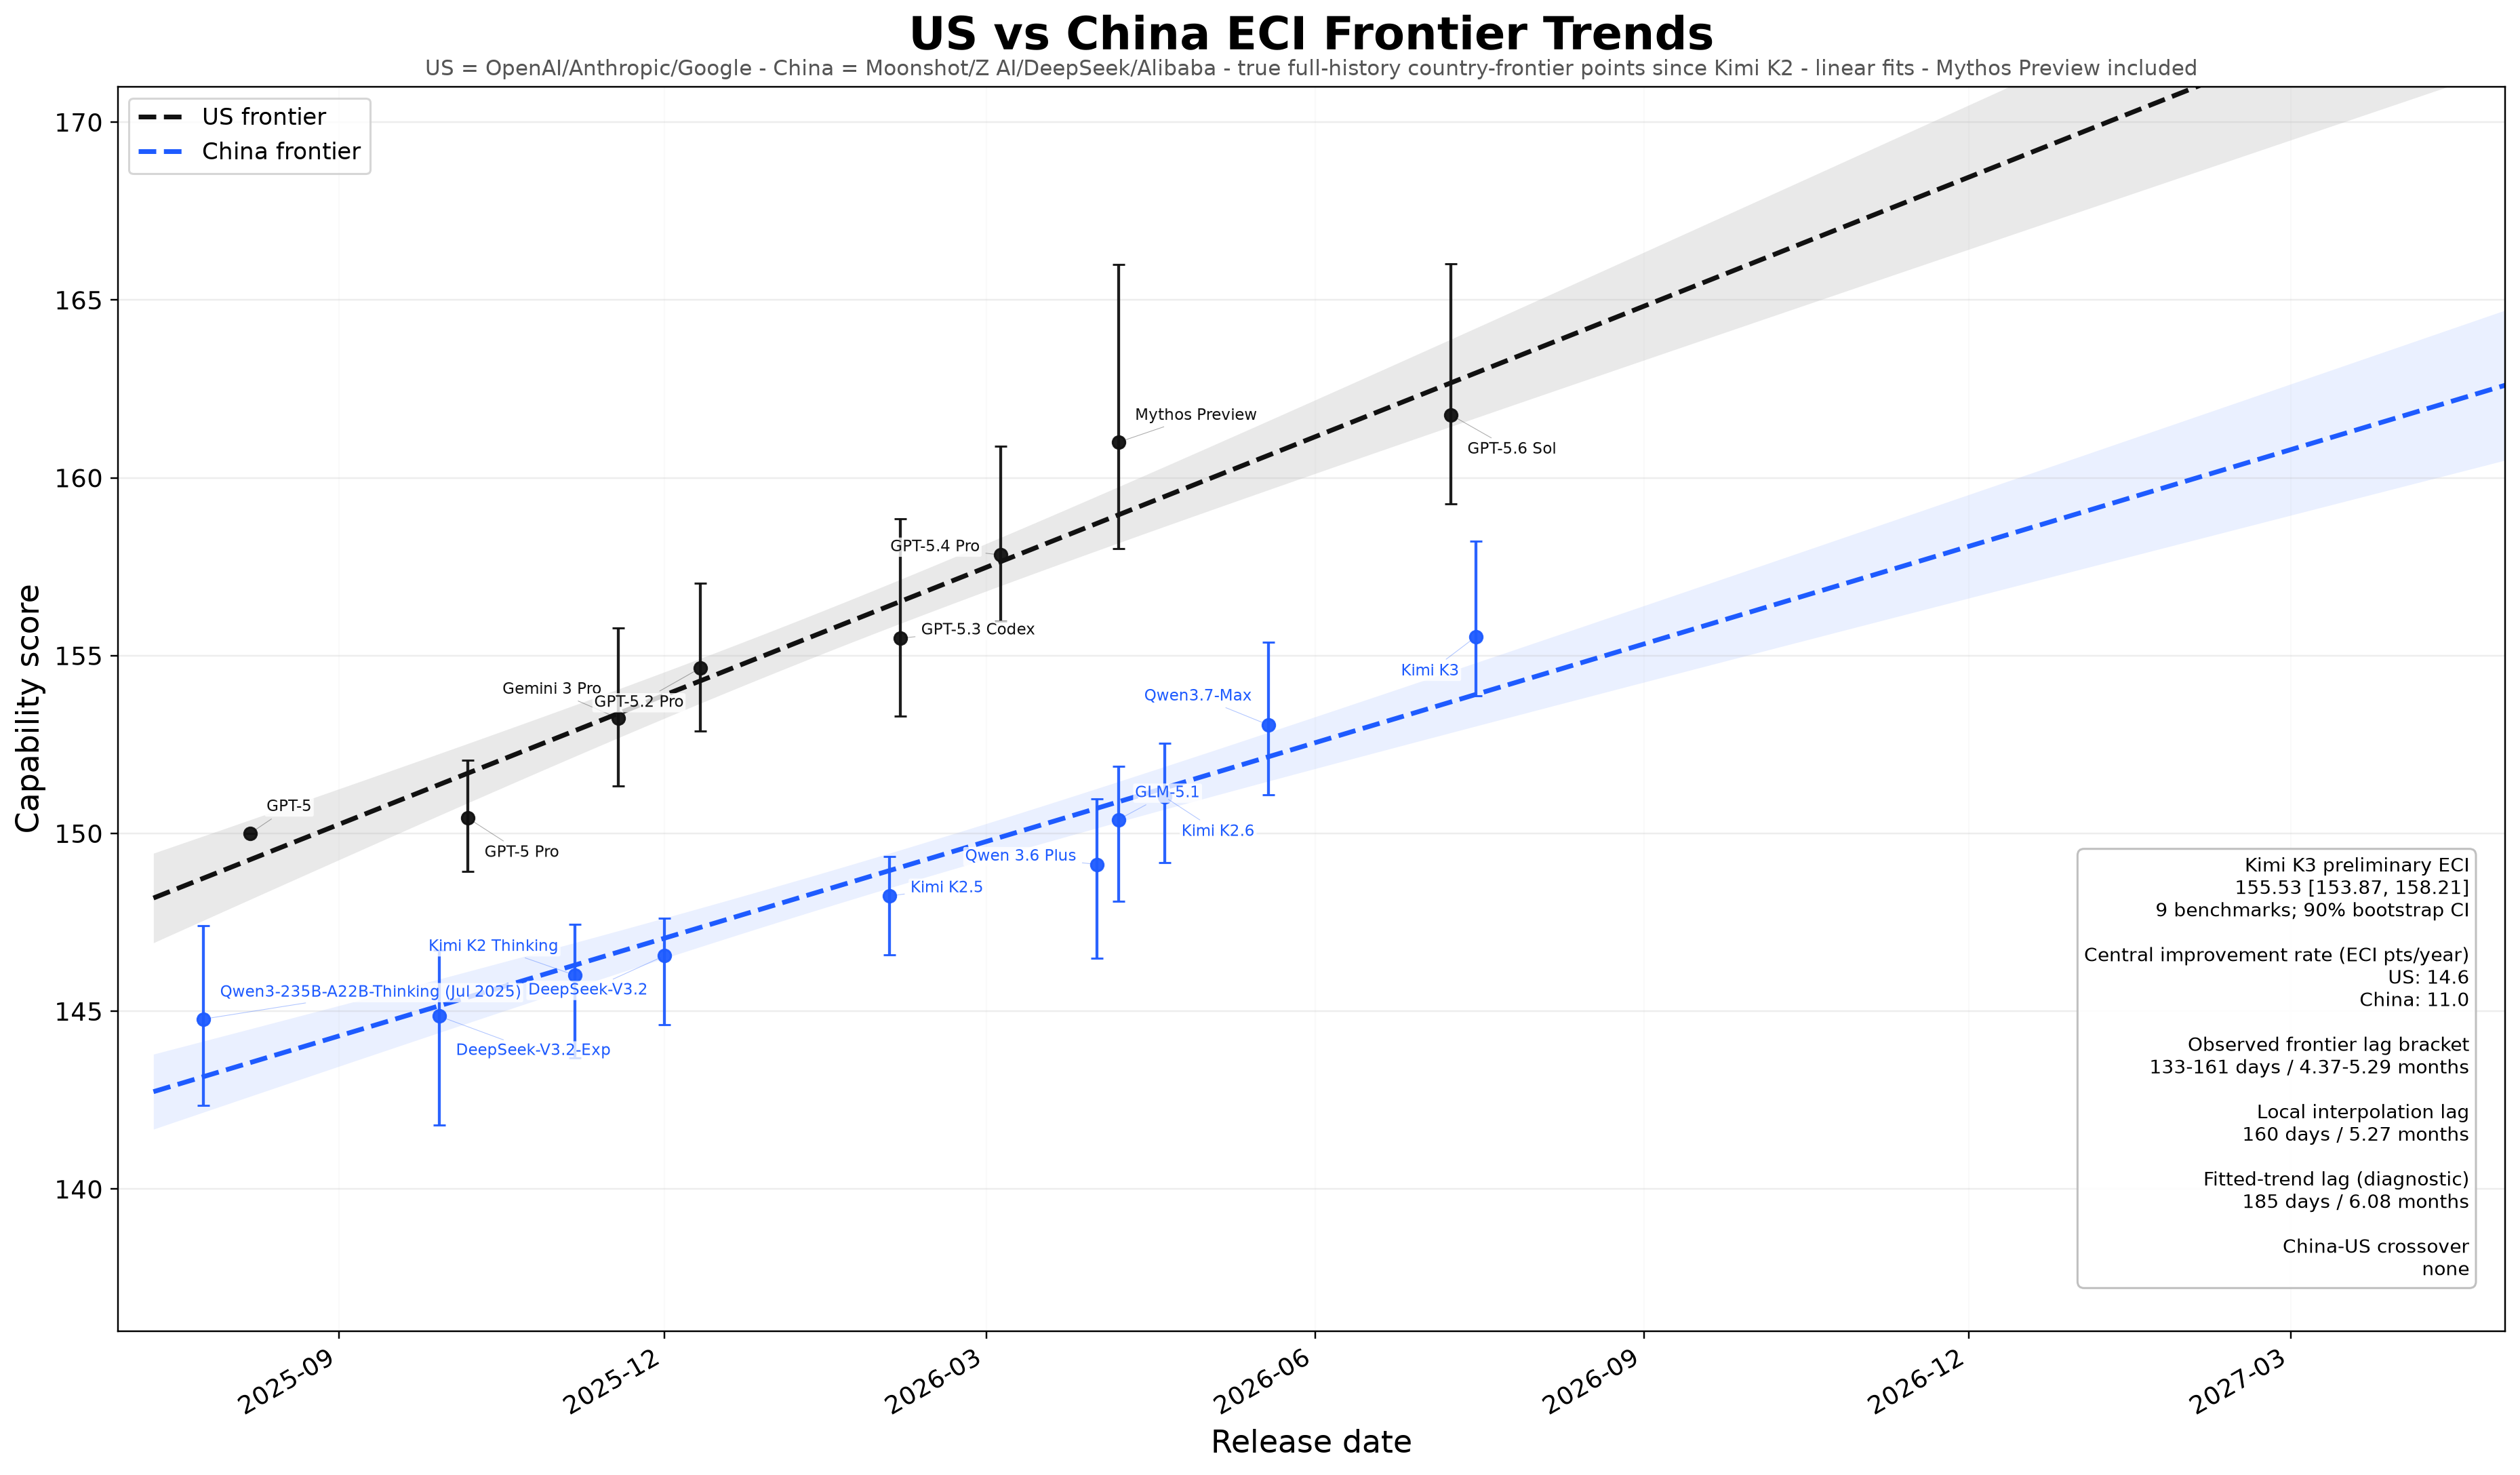
AAI: behind by 1.22 to 1.61 months, 2.89 on the trend line, overtaking November 9, 2027.
ECI: behind by 4.37 to 5.29 months, 6.08 on the trend line, crossover field: none.
The backward gap differs by more than 3x. On the first stick China is moving faster; on the second the US is.
Drop to the lab level and the ranking nearly inverts
Looking only at national frontiers hides the pace of individual labs, so both charts have per-lab versions. Put the annual progress rates side by side and you can see just how far apart the two methods land.
Moonshot falls from first on the left to below OpenAI on the right; Anthropic climbs from fifth to a commanding first. Only Google holds its position among the seven: 21.4 and 6.3, last on both.
On the AAI per-lab trend, Moonshot has the steepest slope and crosses the US frontier line on February 8, 2027 — the original text describes this as passing Anthropic. On the ECI per-lab trend, Moonshot's crossover field also reads none, and even with Mythos Preview removed from Anthropic's data, Anthropic's rate stays at 18.1 points per year, still the fastest.
The two per-lab trend charts, and how Kimi K3's ECI was estimated
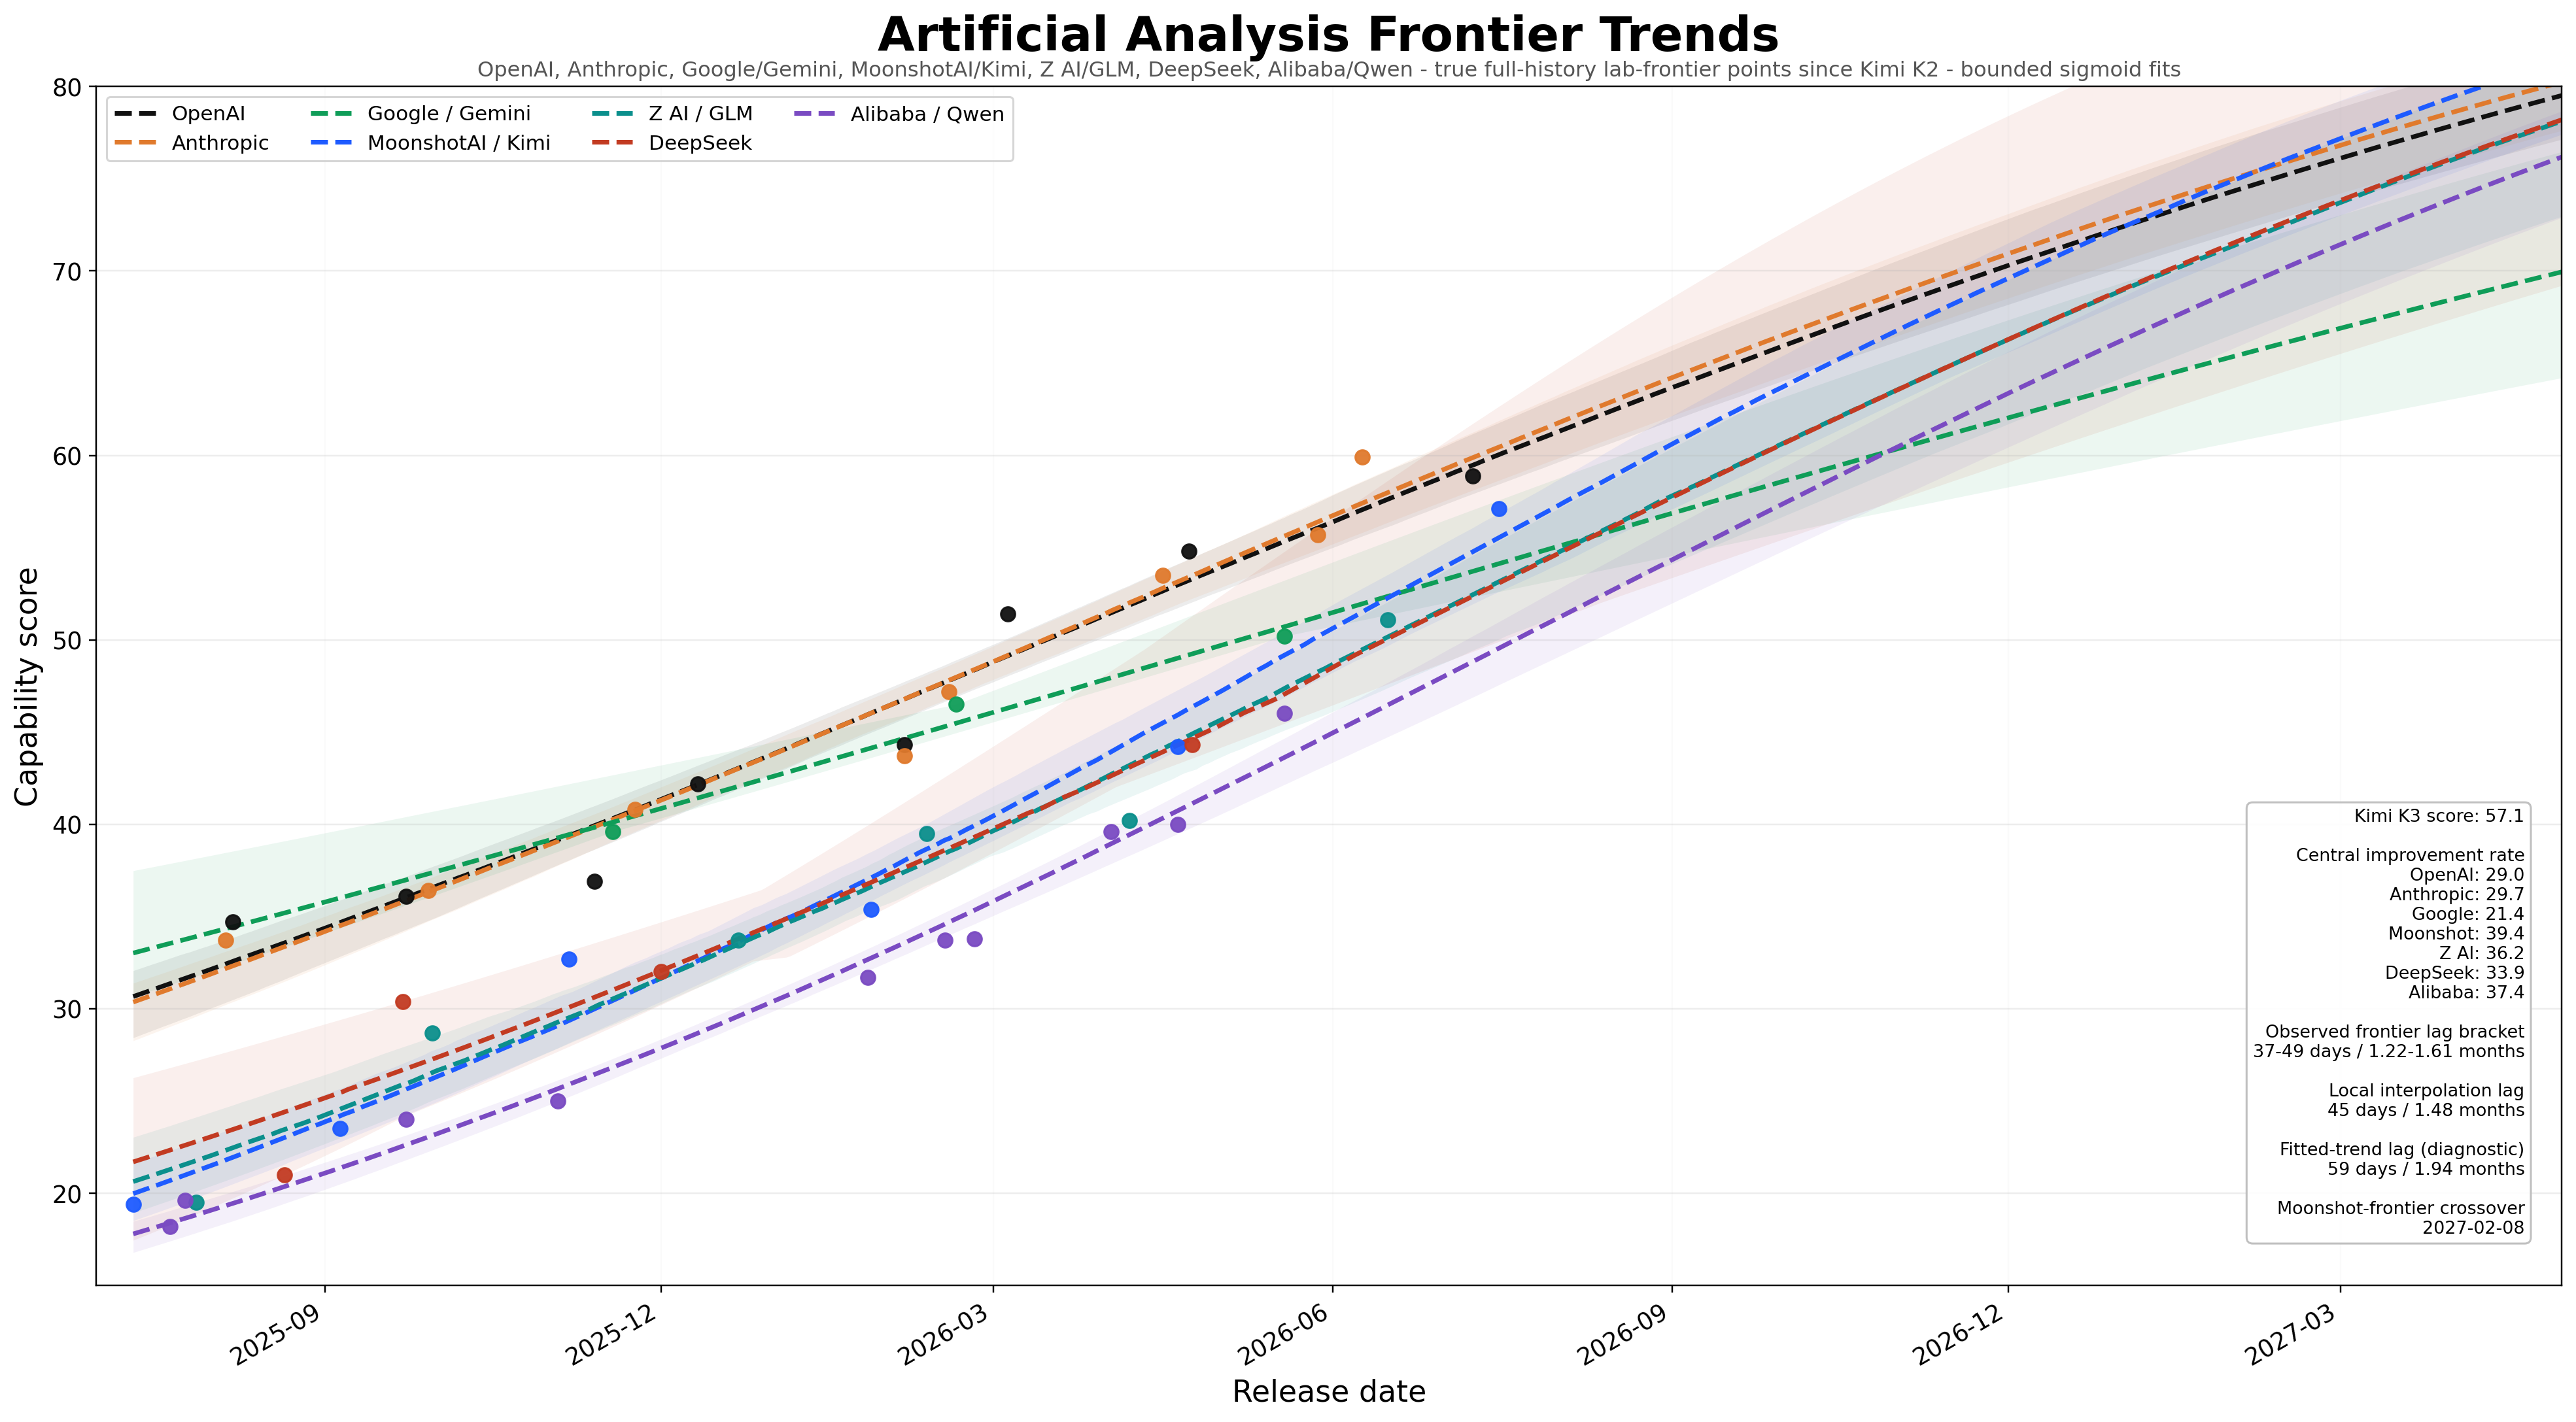
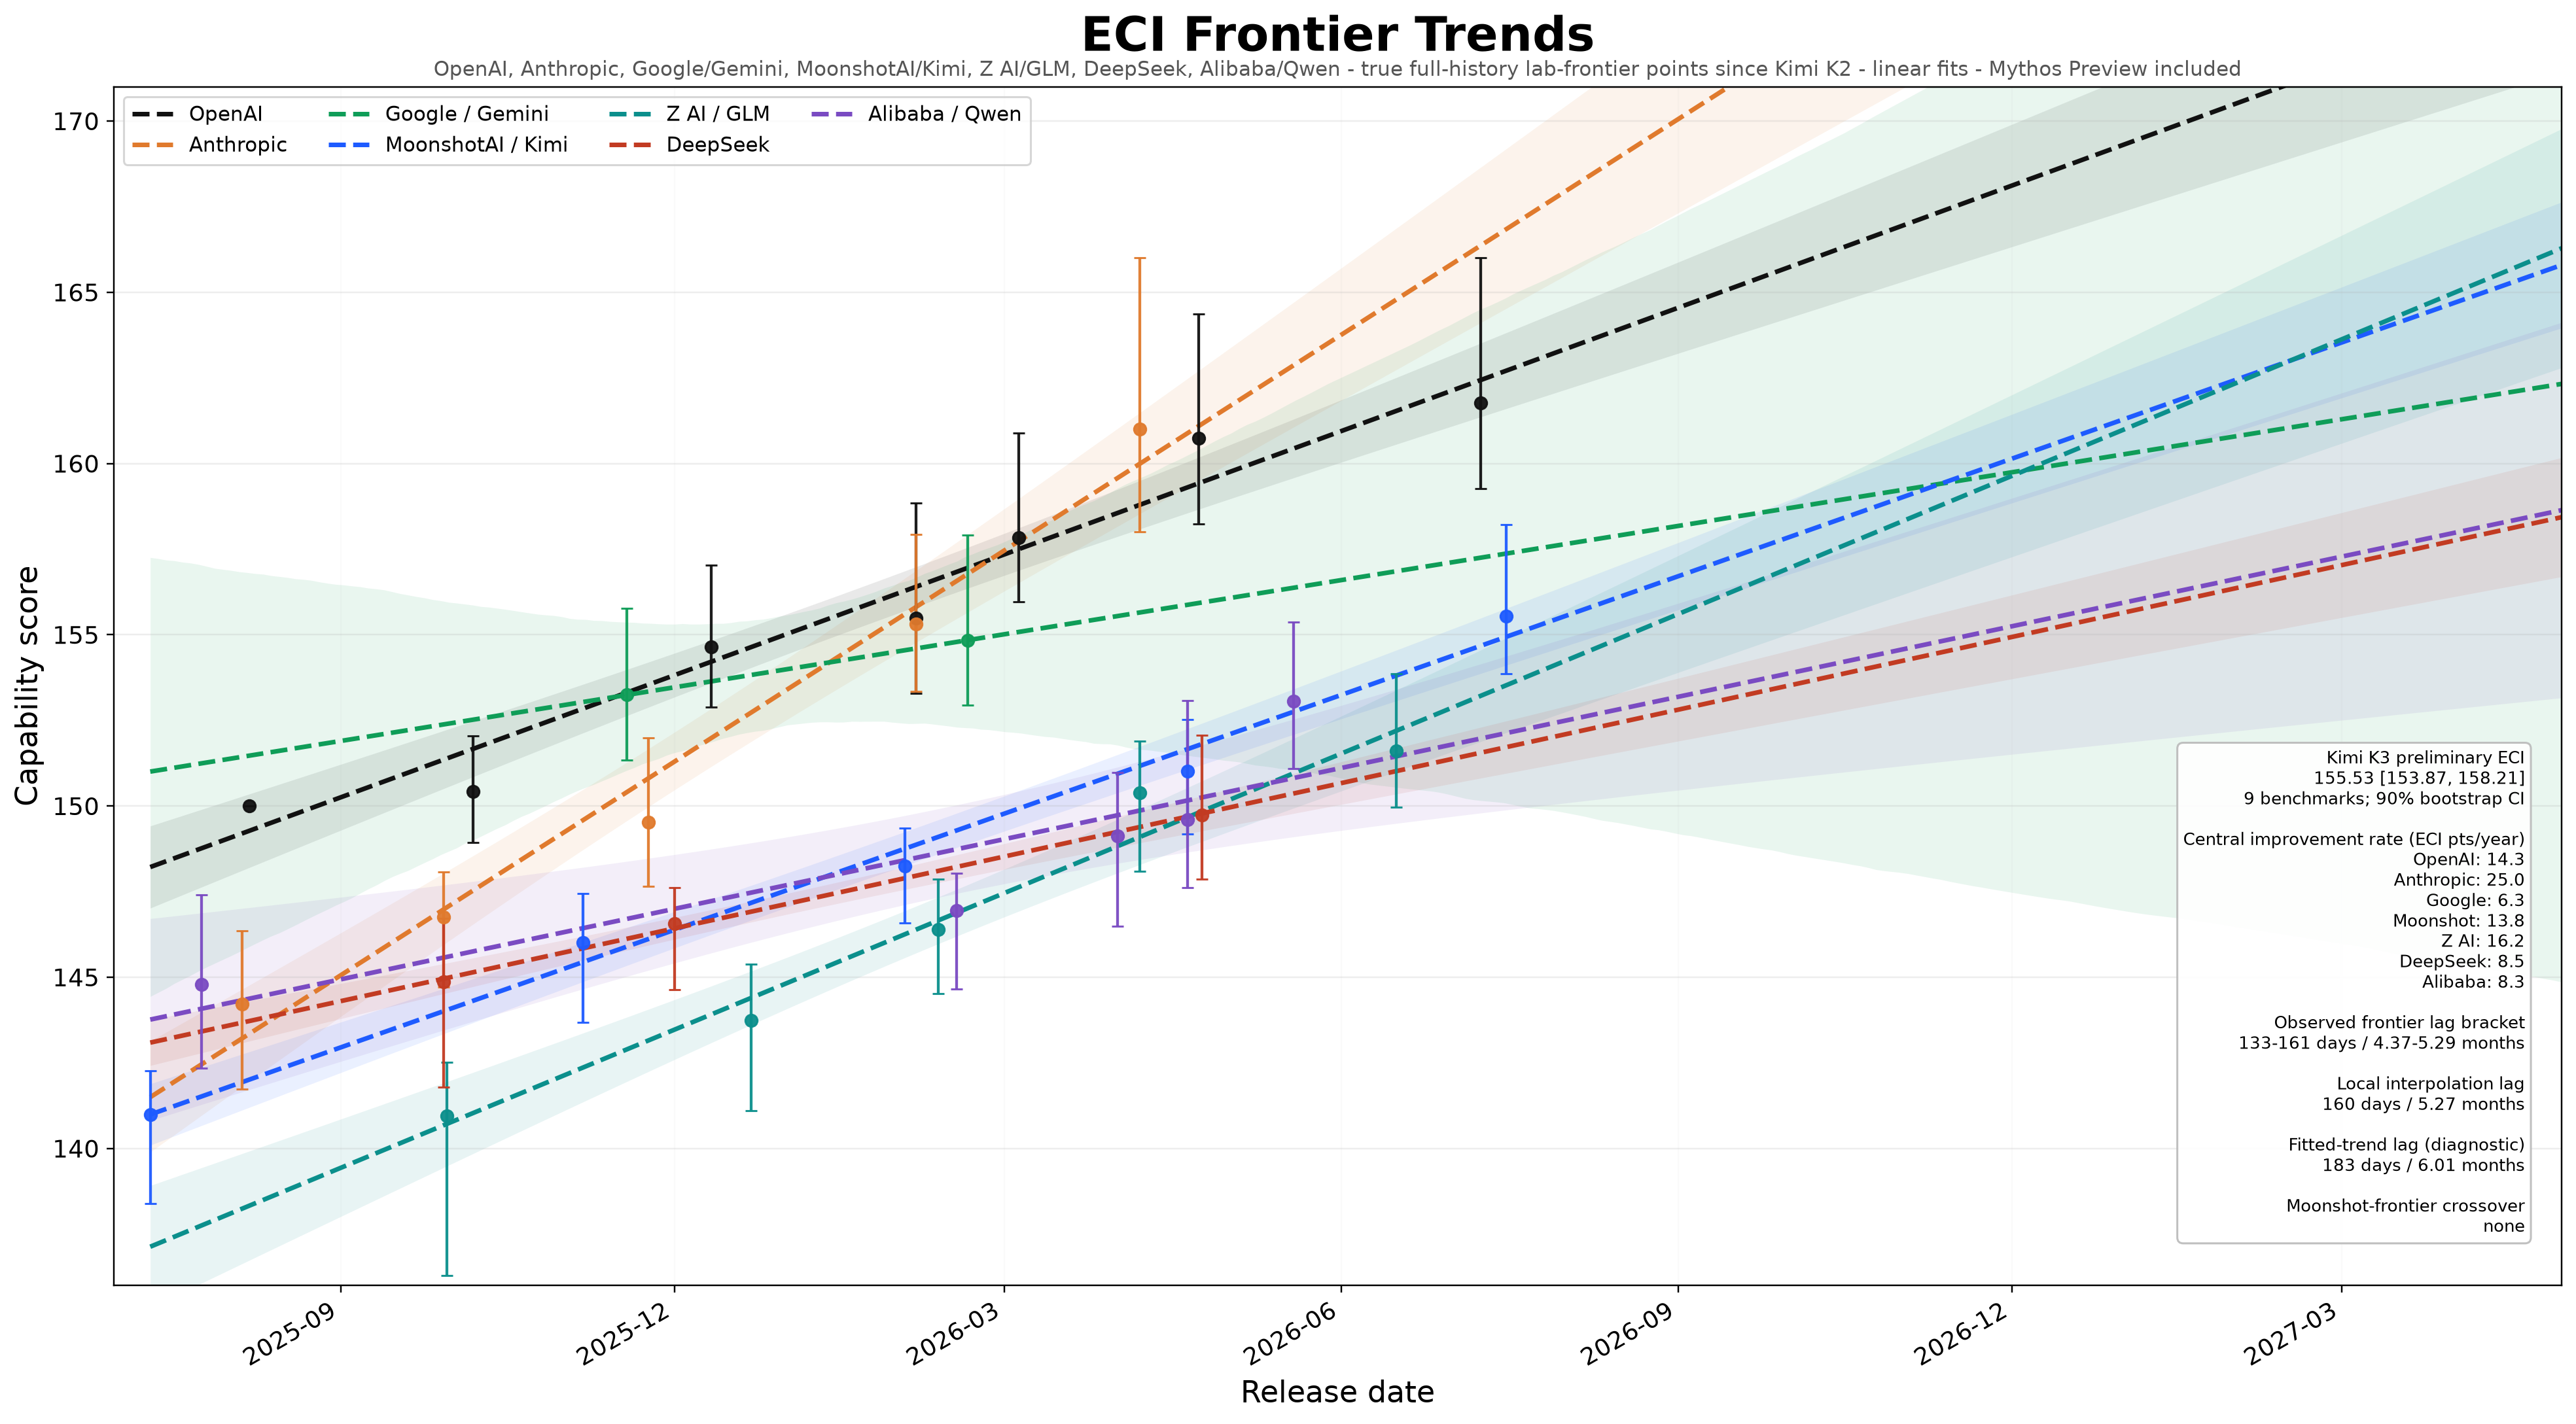
Before Epoch's scores came out, the author ran his own estimate. The community poll put Kimi K3's ECI at 158 to 159; he guessed 156 to 157; analyst Teortaxes guessed 157 to 158.
To avoid relying on intuition, he used the high correlation between AAI and ECI to convert between them. A straight line doesn't work: AAI is capped between 0 and 100, so scores bunch up near both ends, while ECI is unbounded and linear. The result is a line that overestimates at the weak end around Claude 2 and Claude 3, underestimates through the middle, and overestimates again among strong models.
The fix is to apply a logit transform to AAI first — the inverse of a sigmoid — which pulls the compressed ends back apart before fitting.
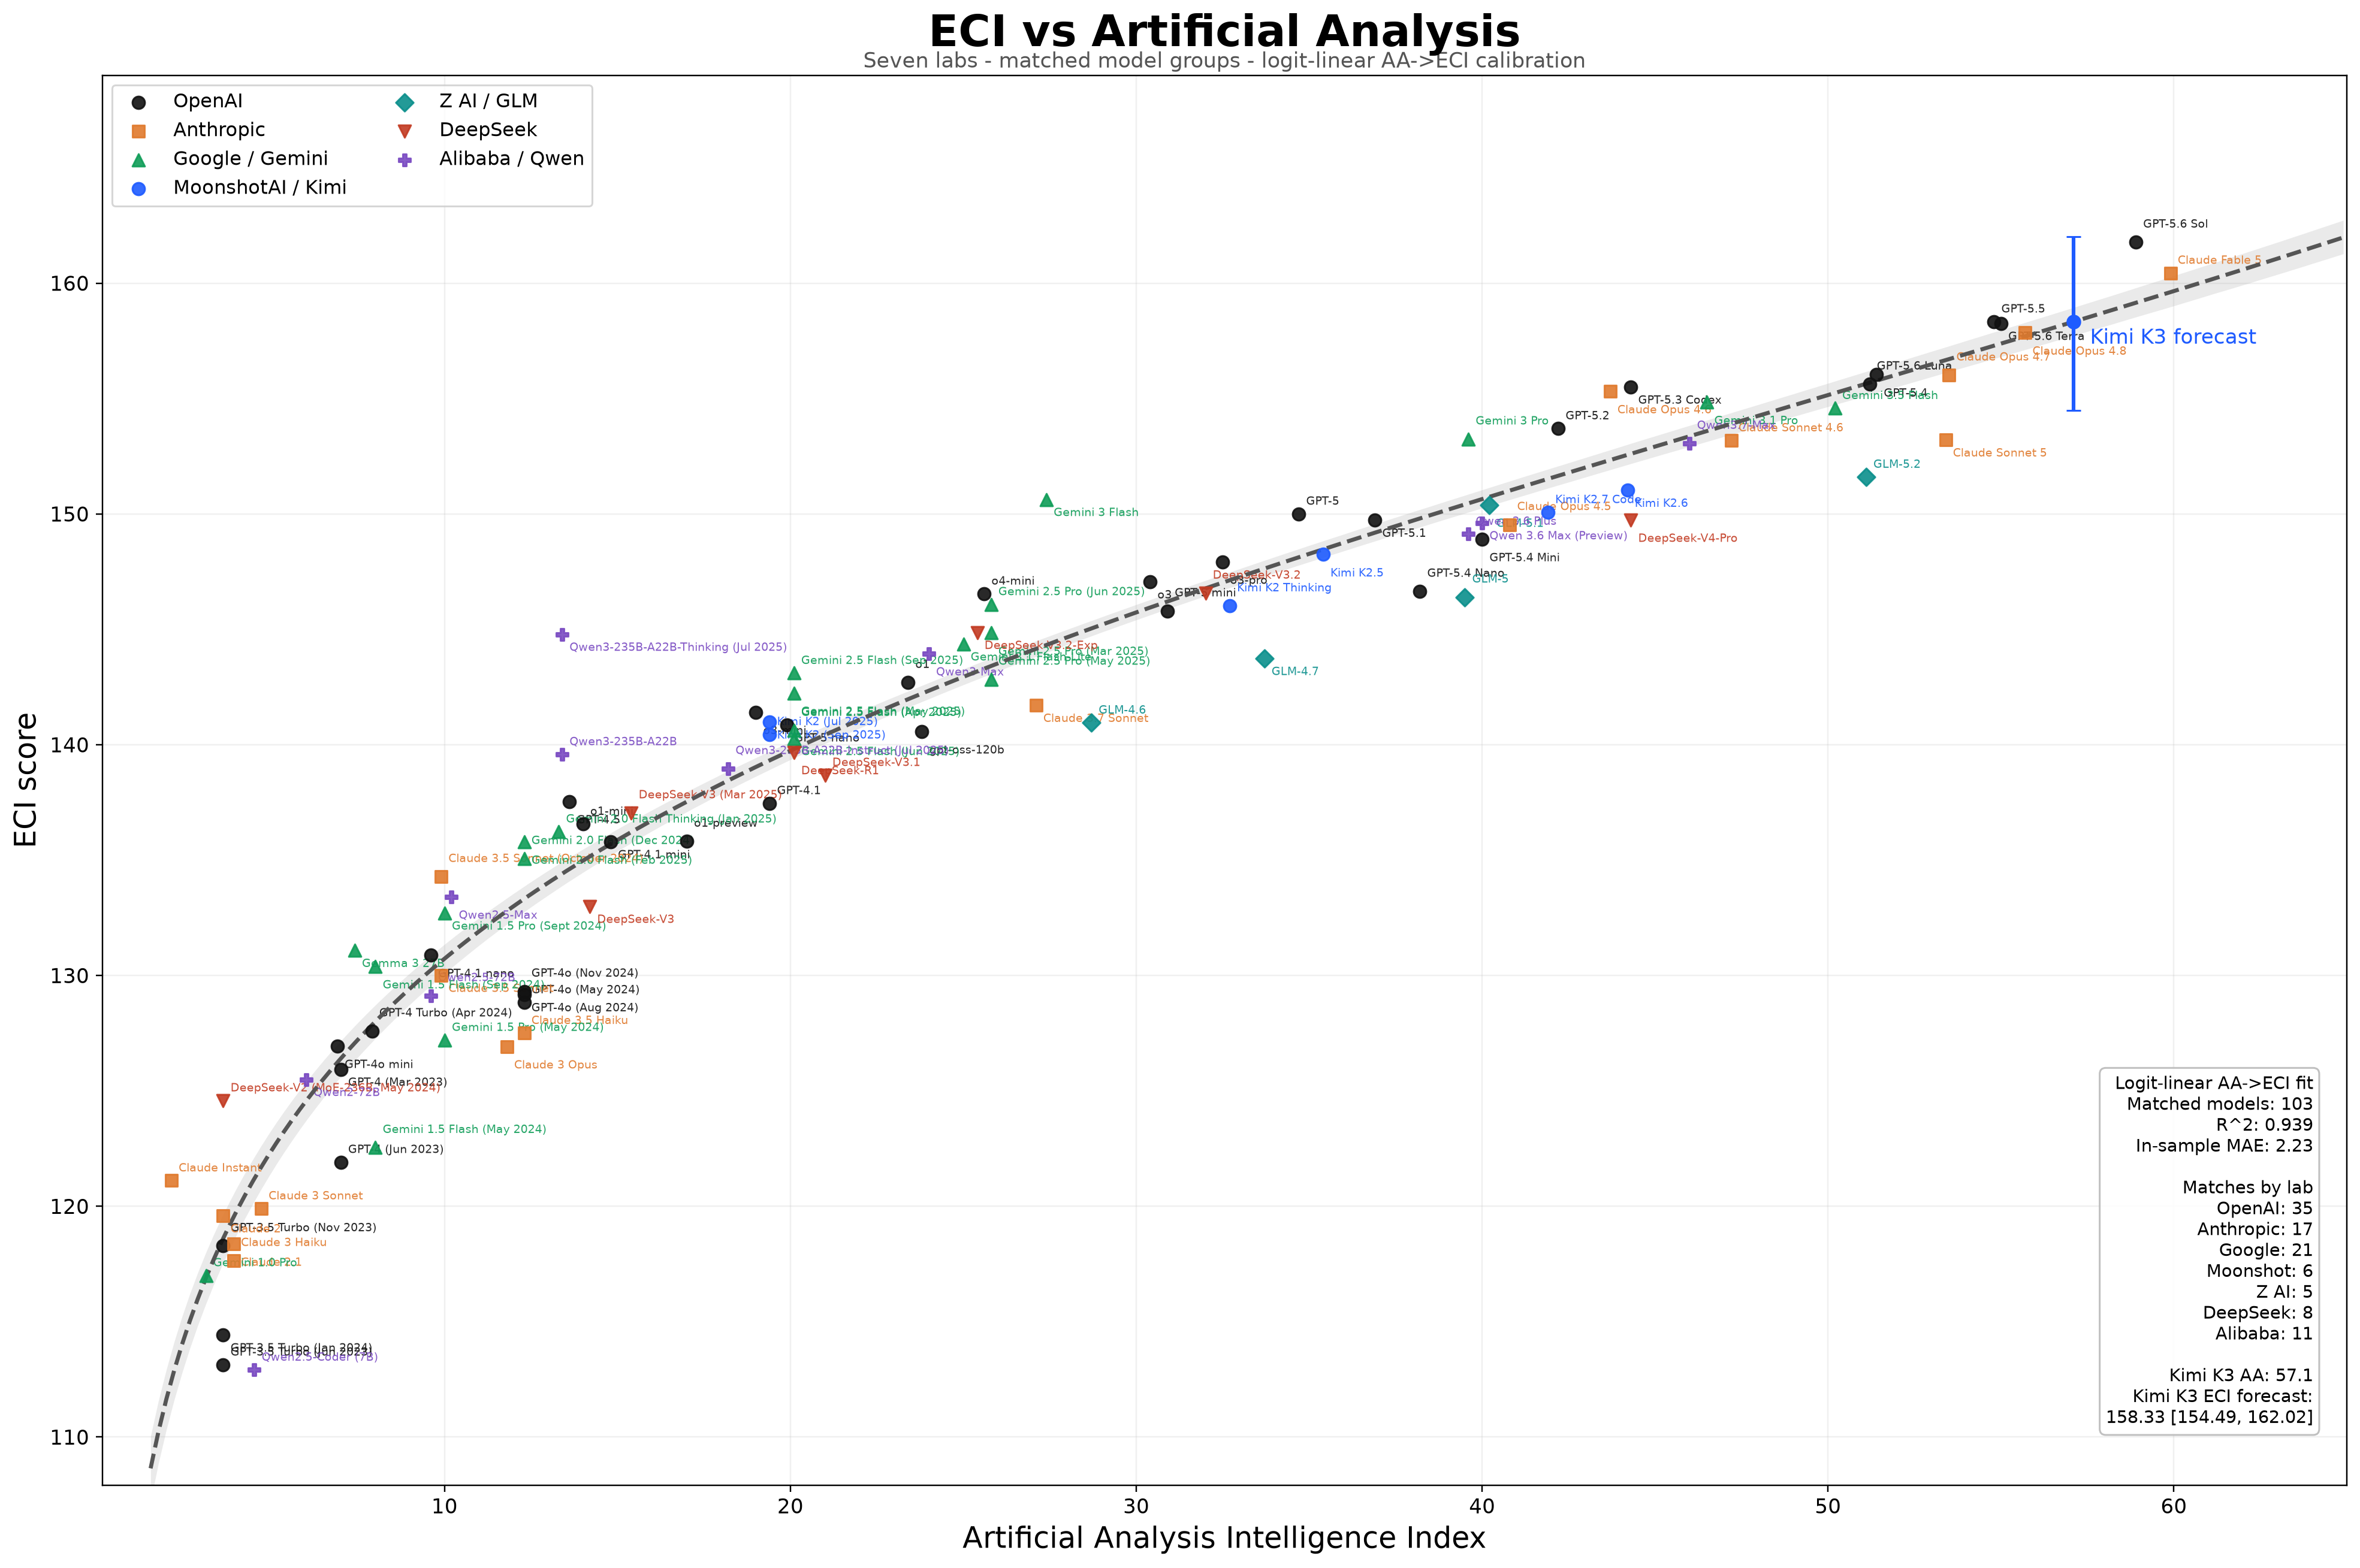
The conversion produced an estimate of 158.33, with a bootstrap 80% interval of 154.49 to 162.02. Epoch's scores then arrived, and fitting 9 benchmarks directly gave 155.53 — inside the interval, but toward the low end. The rest of the analysis uses 155.53; the conversion formula stays on the shelf for later.
Mythos Preview needed an estimate too. Anthropic only publishes AECI on its own scale, so conversion is required: the Substack Point Estimate computed 161.5 using the ECI method, Ramez Naam got 161 via least squares, and the author also landed on 161, 90% interval 158 to 166. That's close to Claude Fable 5's actual ECI of 160 (interval 158 to 165), which makes sense if Fable 5 is a smaller model distilled from Mythos Preview with extra safety training — both of which would nudge the score down a little.
The forward gap: how long to reach today's best
Flip to the forward question and the answer runs like this. On the national trend line, Chinese models reach Mythos Preview's 161 on March 7, 2027 — about 11 months out. The 90% confidence band spans December 28, 2026 to June 18, 2027, which converts to a lag of 8.72 to 14.38 months.
On the hardest questions, the gap widens
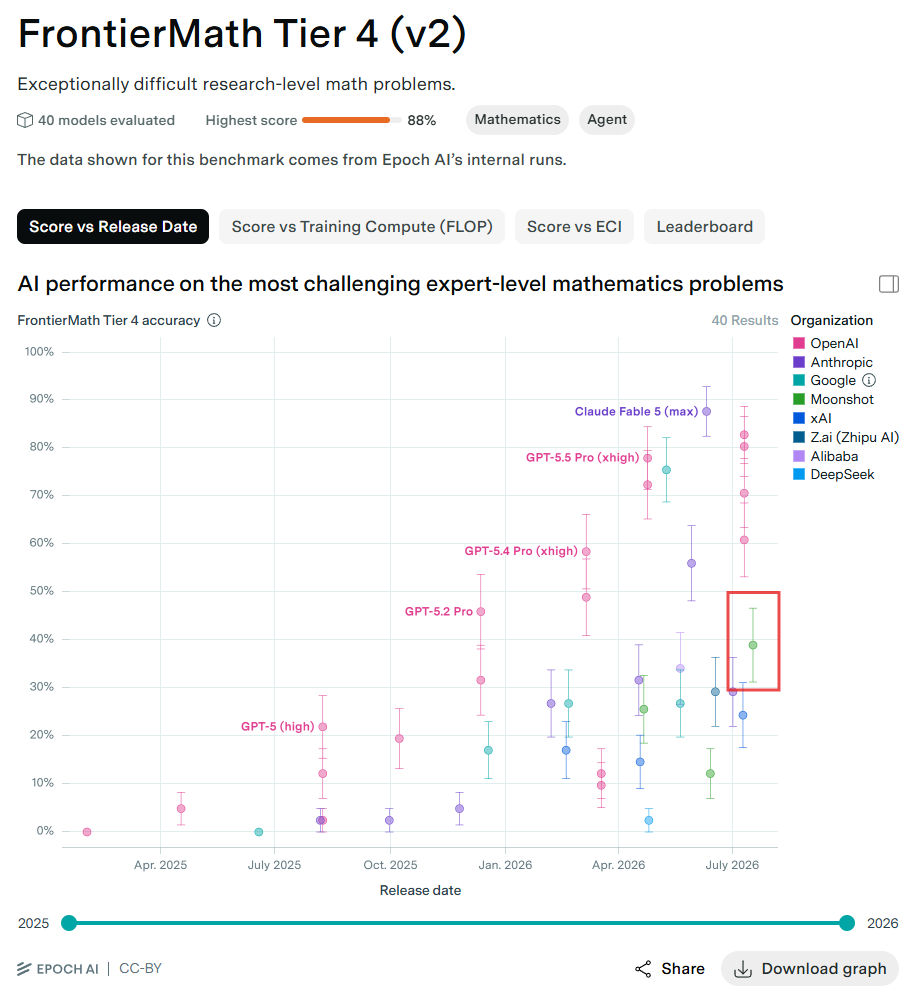
One result in Epoch's preliminary numbers is especially telling. On FrontierMath Tier 4, a set of research-grade math problems, Kimi K3 scores about 39 — still behind GPT-5.2 Pro (around 45), released seven months earlier. On the same chart, Claude Fable 5 scores 88.
Five things this calculation leaves out
The author's own read is that both gap figures run small, because several high-impact factors never enter the formula at all — usually because the numbers aren't public.
One: model size. Kimi K3 is 2.8 trillion parameters. Cursor's Michael Truell has said the Opus and GPT families are comparable in size to Cursor's newly released 1.5-trillion model, most likely referring to Claude Opus 4.8 and GPT-5.4; GPT-5.5 and GPT-5.6 are estimated closer to 3 trillion. So a 2.8-trillion model beating a 1.5-trillion-class Claude Opus 4.8 on some benchmarks doesn't say much architecturally.
Two: inference efficiency. None of the 35 benchmarks measures it, and by the author's read Kimi K3 remains less efficient than US models. Burning more tokens at the same parameter class to reach the same score is a cost no leaderboard records.
Three: real serving cost and total compute. Whether you hold a million of the newest Blackwells or a pile of lower-throughput older Hoppers determines how many instances you can run at once and how fast you can serve users. In a scenario where both countries compete at full tilt, this weighs no less than benchmark scores.
Four: time spent on safety testing. US labs test far more thoroughly than Chinese labs, and that work may add another month to the gap.
Five: how representative the evaluations are. Most benchmarks don't reflect real work, and cost and time limits mean the scoring runs never extract a model's peak performance either.
An understated gap doesn't mean Chinese labs aren't genuinely speeding up, though. They are — unusually so.
And one more layer: US labs are sitting on unreleased models
Mythos is rumored to be a 10-trillion-parameter model. SpaceX AI, OpenAI and Meta are all building their own 10-trillion-class models. The author's view is that Kimi K3's apparent parity is likely Chinese models catching the previous generation while US labs have already moved to the next one — holding their strongest models back because of legal uncertainty around cyber and bio-chem capabilities.
- Kimi K3 is 2.8 trillion parameters, open weights
- Michael Truell's statement that Cursor's 1.5-trillion model is comparable in size to Opus and GPT
- Epoch has published Kimi K3's FrontierMath and other benchmark scores (the ECI of 155.53 is the author's fit from those, not an official Epoch figure)
- Anthropic uses AECI in its system cards to measure model strength
- Mythos at 10 trillion parameters is a rumor
- GPT-5.5 and GPT-5.6 near 3 trillion is an estimate
- Claude Fable 5.1 and GPT-6 finished training but unreleased
- Safety testing adding another month is the author's order-of-magnitude judgment
- Every 2027 crossover date is a trend-line extrapolation
If Anthropic and OpenAI actually shipped Claude Fable 5.1 and GPT-6, there would be no catch-up discussion at all, because these 10-trillion-parameter models are something else entirely.Lisan al Gaib, scaling01
Why Chinese models suddenly got faster last August
Chinese labs really have accelerated, and the starting point is specific. The author tries to locate the inflection by taking the derivative of the index with respect to time, while acknowledging it's not a great estimator.
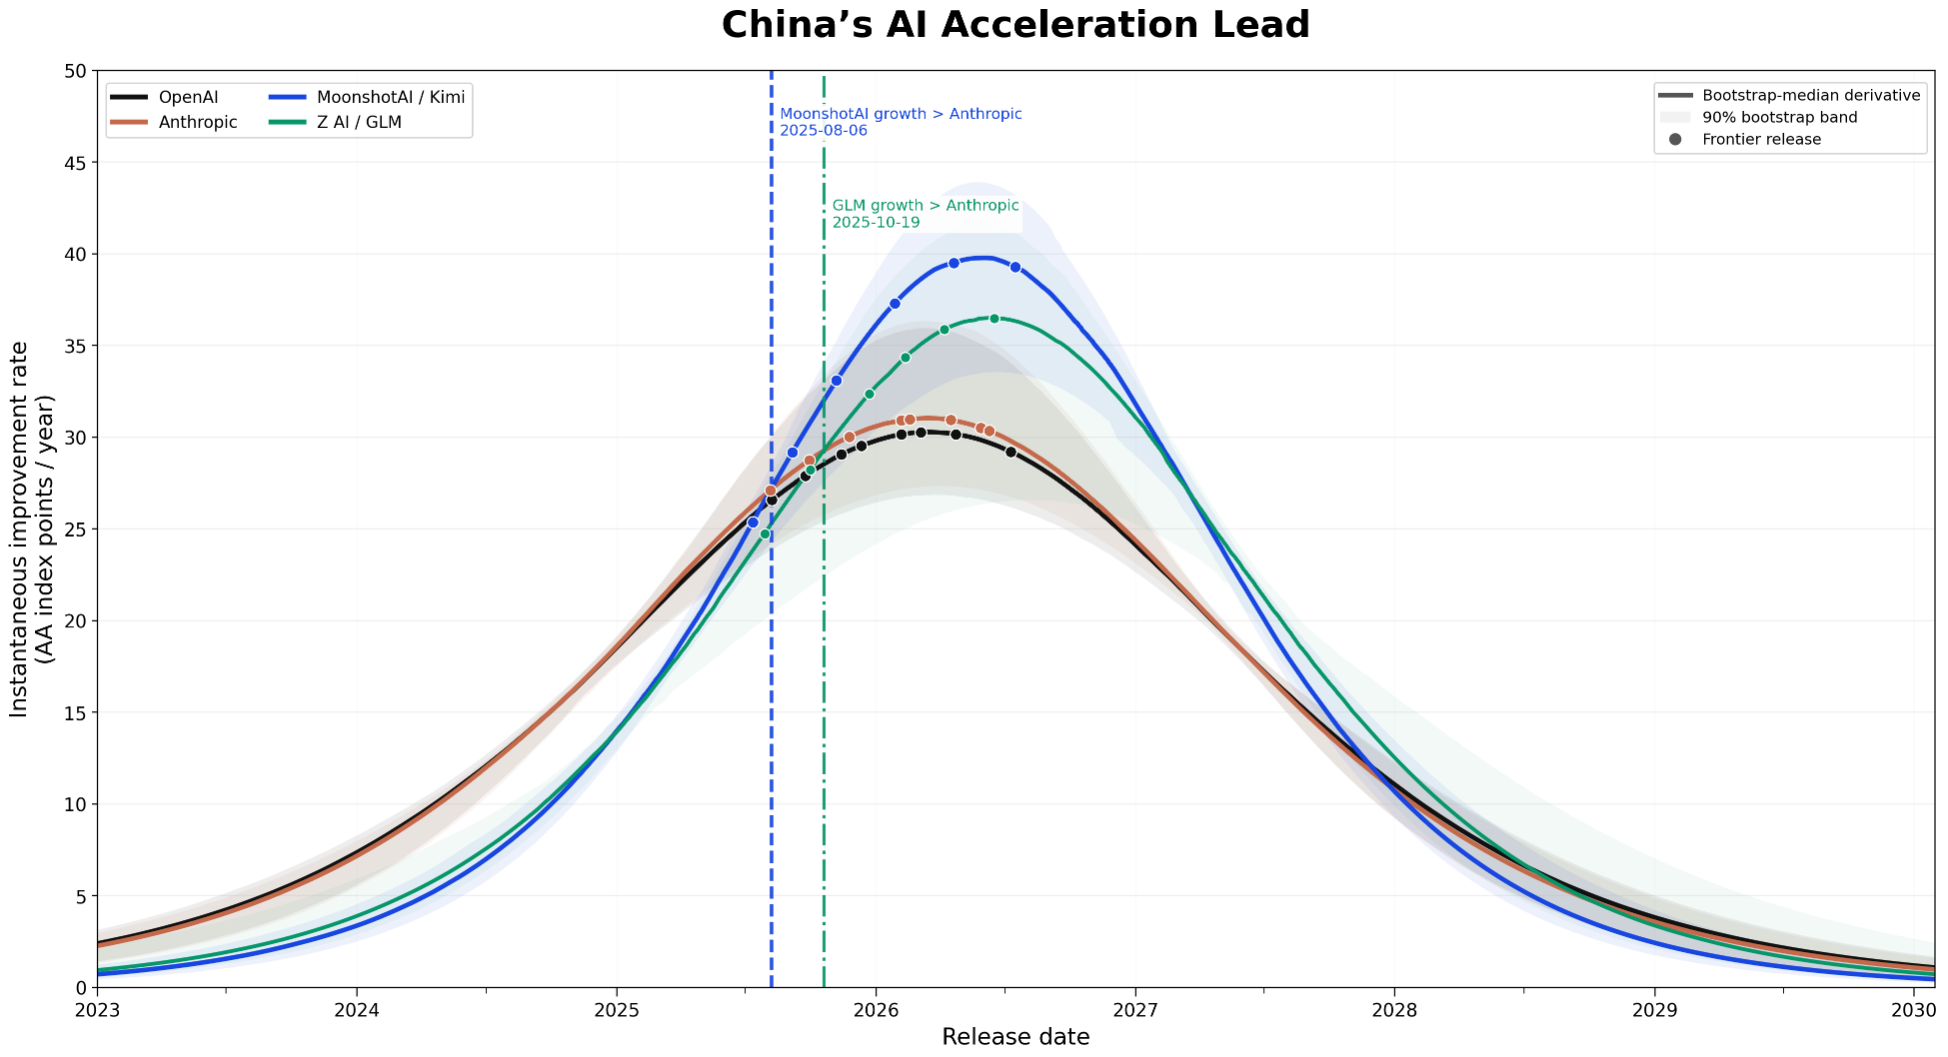
The pattern itself is strange: US labs have more compute, more data, more talent, and stronger models to accelerate their own research — yet they're progressing more slowly. The author first checked a technical explanation. Could it just be that the index is capped, so the US, already scoring high, has a harder climb and only looks slower? He applied the logit transform to strip that compression out, and Moonshot and Z AI still peak higher.
Distillation is part of it, but not all of it
Distillation in the strict sense requires access to the model itself, but using a stronger model to grade a weaker model's outputs already counts as a version of it. Anthropic has repeatedly reported tracing distillation attacks back to Chinese labs. So it's real; outsiders just don't know the scale or how much it helped. The author's phrasing: some portion of the capability Chinese models have gained comes from distillation.
Beyond that, several other explanations exist, and the author's view is that reality is a combination of them:
- Catching up beats trailblazing — the frontier hands you the direction to improve in.
- The capabilities AAI measures are publicly visible and well suited to grinding upward with reinforcement learning, which makes them natural targets to optimize against.
- Only the two fastest-growing Chinese labs were selected — the ones whose bets paid off, which is selection bias.
- Few models are included, so this could just be a lucky observation window.
One caveat has to travel with all of this: the catch-up narrative holds on AAI only. It does not hold on ECI.
Counter-evidence: the harder and longer the task, the wider the gap
The UK AI Security Institute's cyber range is among the hardest evaluations around — the tasks are brutal, and it takes 100 million tokens to push a model to its limit. Epoch's MirrorCode goes further still, burning a billion tokens on a single model.
In this 32-step enterprise network attack simulation, GLM-5.2 averages about step 11, on par with Claude Opus 4.5. GPT-5.6 Sol reaches about 29, and Anthropic's newer Claude Mythos 5 about 27. Yet on the self-reported coding benchmarks, GLM-5.2 scores close to Claude Opus 4.8.
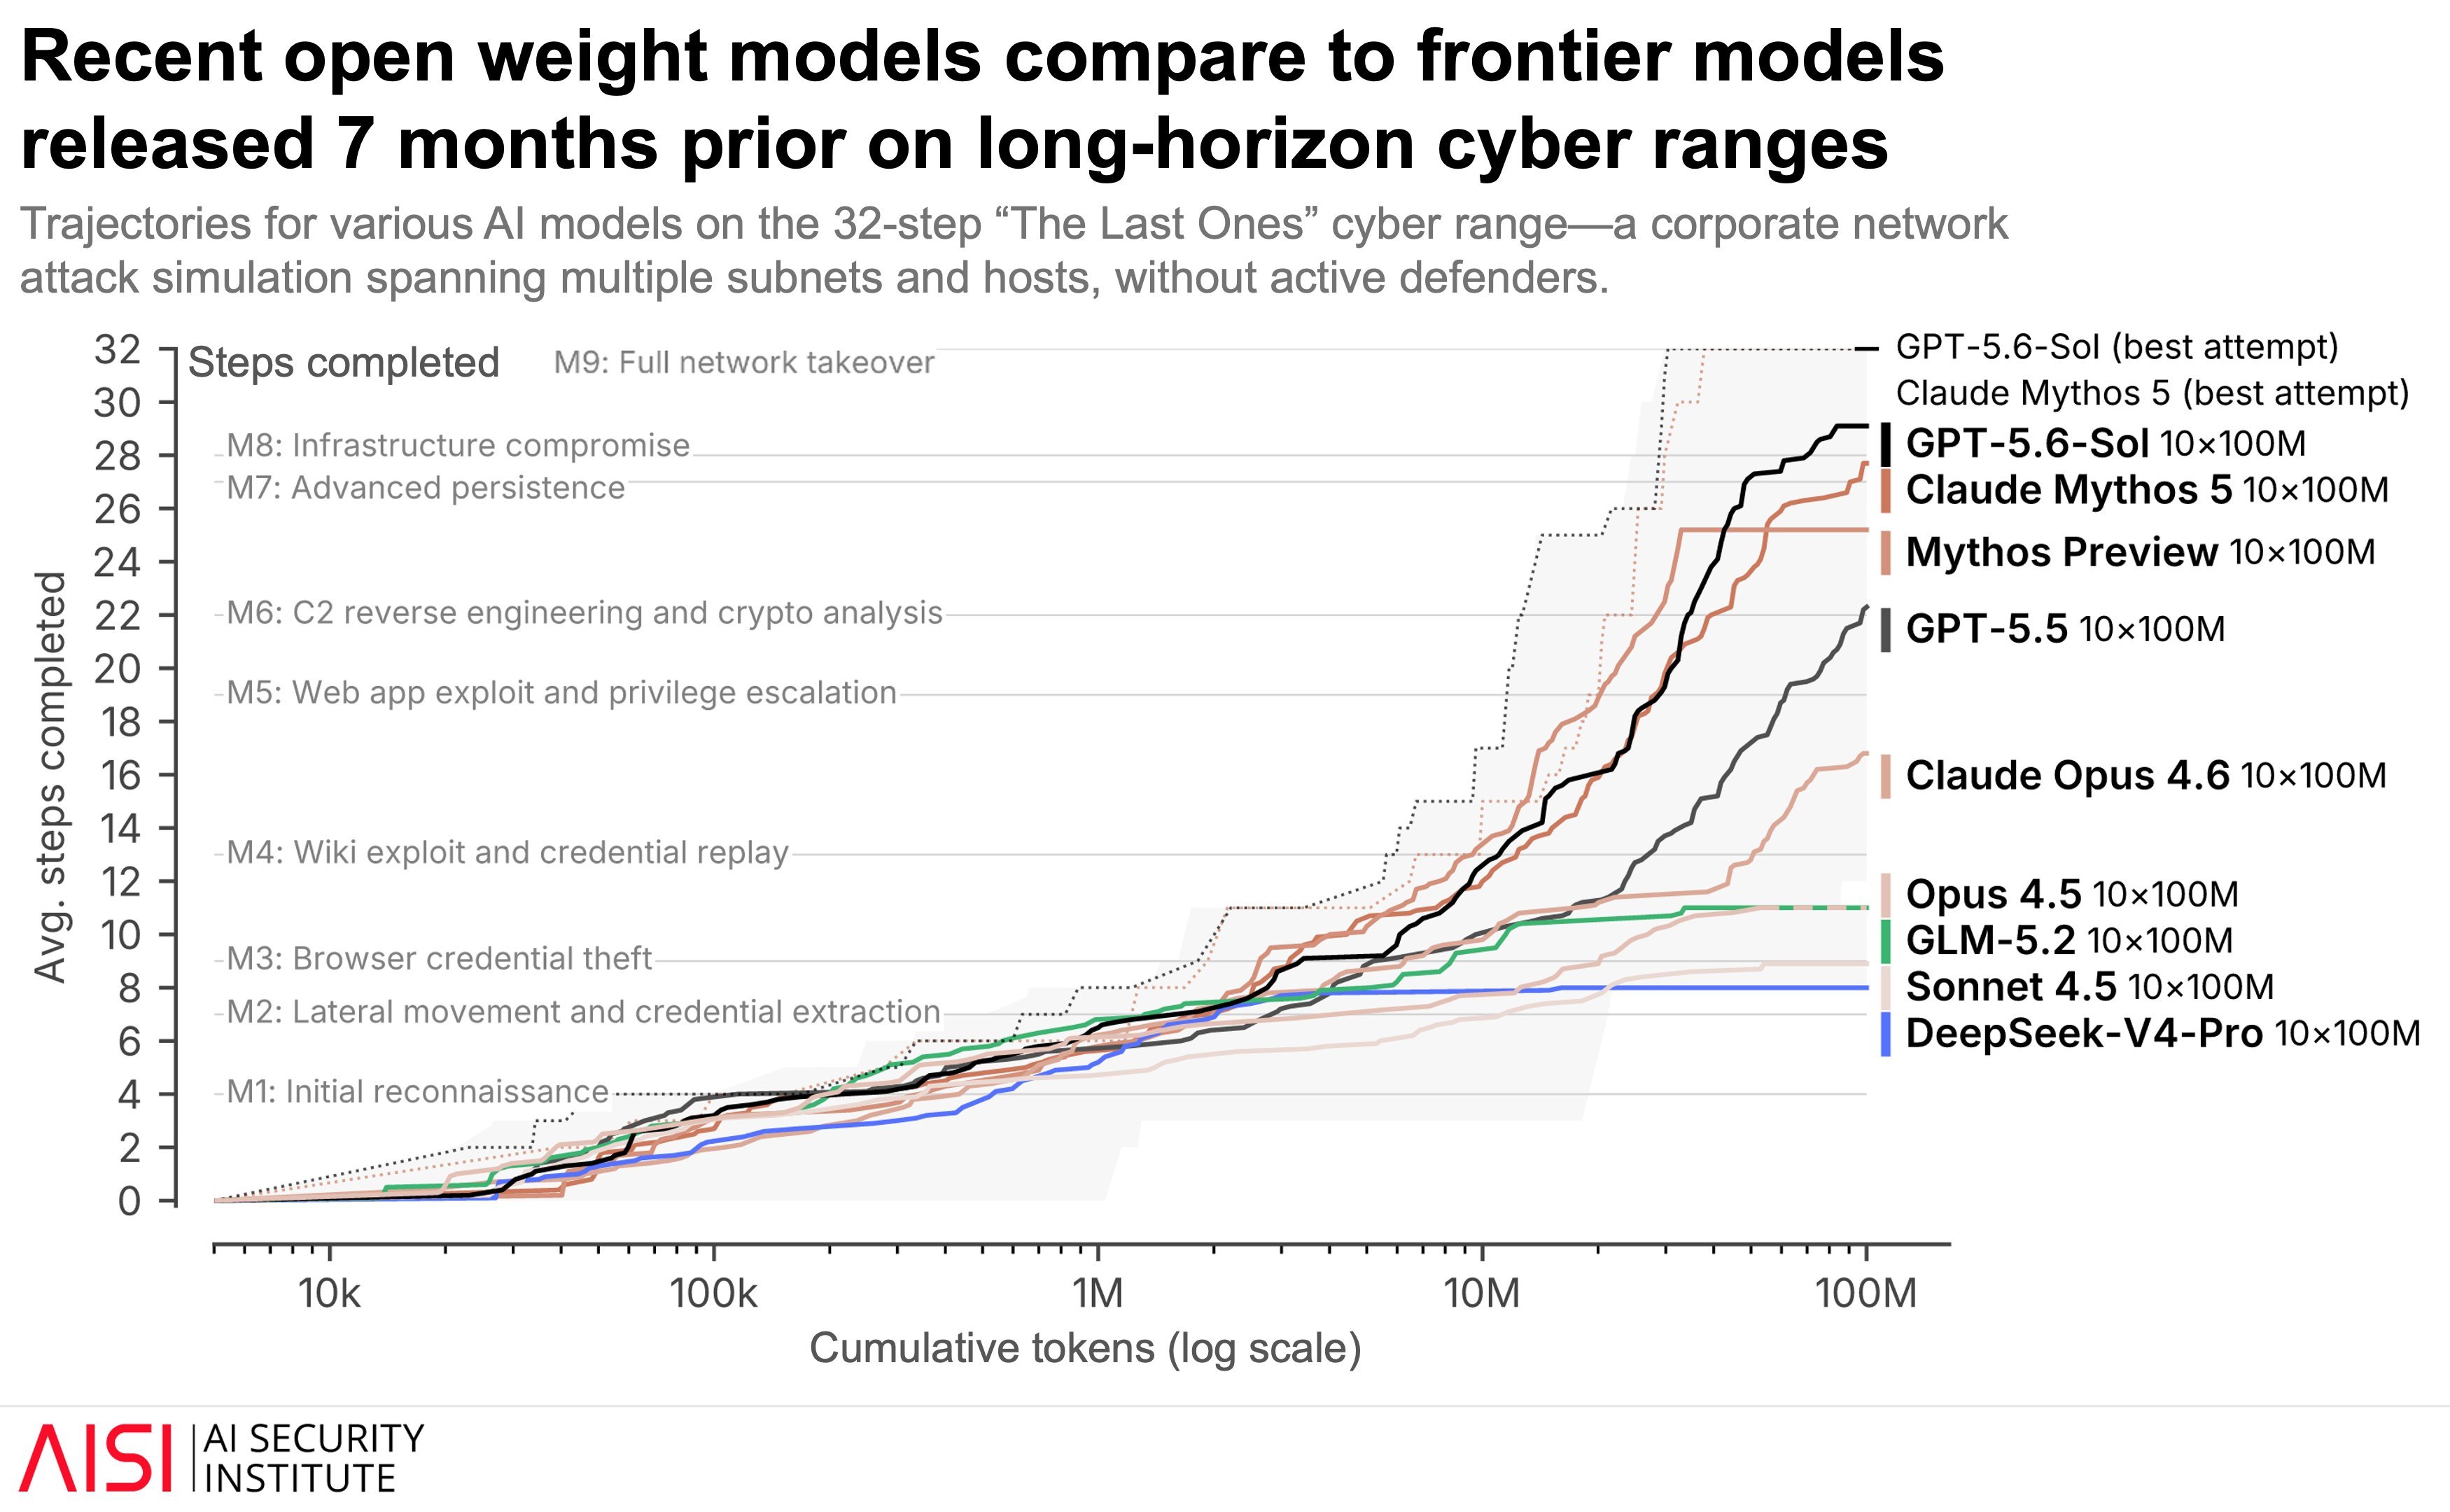
The same model scores near the latest Claude Opus 4.8 on public, easily-targeted coding leaderboards, then falls back to the seven-or-eight-month-old Claude Opus 4.5 on hard tasks requiring sustained multi-step work. That drop is itself a signal.
The piece closes on an observation: if Chinese models were genuinely as strong as the US frontier, they ought to be cracking some previously unsolved math and physics problems. So far, nobody has seen it.
Same models, different yardstick → the US-China AI gap goes from one month to five
Independent analyst Lisan al Gaib turns "has China caught up?" into a question you can actually compute — and one page explains why two yardsticks give opposite answers.
↓ one page, one animated diagram
Moonshot shipped the 2.8-trillion-parameter Kimi K3 on July 16, and "China has caught the US" spread fast. The report card is genuinely strong: 30 wins out of 35 self-reported benchmarks against Claude Opus 4.8, and first place in the frontend coding arena at 1679. But how much that claim can carry depends entirely on how those 35 were chosen.
✘ What they don't prove: how far behind it is overall.
Because the choice of tests decides the conclusion. Of the 35, 24 are vision and agent tasks — nearly seventy percent. Long context: none. Cyber, bio and other safety categories: none. Serious math: barely any. How many tokens a model burns per answer (token efficiency, i.e. how much compute it spends): also none. The absences say more than the entries.
Run the same models over the same period through two evaluation systems and it's not just the numbers that differ — the direction flips too.
Agents 34% + Coding 24% = 58%
Benchmark difficulty → ignored
Verdict: behind 1.22–1.61 months
Overtake 2027-11-09
Estimates difficulty + discrimination
then backs out capability
Verdict: behind 4.37–5.29 months
Crossover: none
Even the acceleration story inverts. On AAI, all four Chinese labs post faster annual progress than the three US labs, with Moonshot leading everyone at 39.4. On ECI, Anthropic leads by a mile at 25.0 while Moonshot drops to 13.8, behind OpenAI's 14.3.
The method is borrowed from educational testing and called Item Response Theory. In a sentence: two students both score 60, one on a grade-school test and one on an olympiad paper, and those describe wildly different ability — so to compare them, you first need to know how hard each paper was.
"Three times bigger" is abstract; days are not. Same question — how many days ago did the US frontier sit where the Chinese frontier sits today — and here's what each yardstick says:
over Claude Opus 4.8
out of 35
- × Long context
- × Serious math
- × Safety tests
- × Tokens burned per answer
needs capability 129
hardest tier
where "three times" comes from